A user asked for help with high latency events on a machine. They have set up traceroutes to monitor the network, but the data doesn’t seem to correspond to the displayed value. Another user suggested looking at the device at the time of the spikes and running a continuous ping. It was also mentioned that the traceroutes and pings are only run at set intervals, so some packets may have high latency while others are in a lower range.
Read the entire ‘Troubleshooting High Latency Events in ControlUp Network Monitoring’ thread below:
Good morning/day,
I am looking in to a machine that is having high latency events. We have setup a couple of trace routes to servers to monitor the local network. I can see latency spikes at 150 ms. When I click on the traceroute the data doesnt seem to correspond to the displayed value. The differerent hops show a collected delay of 5ms, but the overall latency is displayed as 150 ms. Can anyone explain where this difference is coming from?
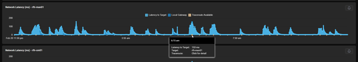
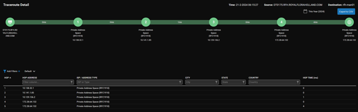
You would probably need to look at the device at that time, the latency and traceroutes are just running pings and traceroutes at set intervals (I think 10 minutes for a trace route and 1 for the pings) and displaying what it gets. I would bet if you ran a ping -t on the device at the time of these spikes you would see some packets have very high latency but many are still in that lower range.
Continue reading and comment on the thread ‘Troubleshooting High Latency Events in ControlUp Network Monitoring’. Not a member? Join Here!
Categories: All Archives, ControlUp for Desktops