The Device Score Beta on the dashboard shows a different score than the device view, possibly due to different time intervals. The drill down dynamically determines the interval while the dashboard is based on the latest 1 minute interval data point. It was suggested that the issue may be due to different raw data points in a single time window and the drill down not taking logon duration into consideration. The PM for this feature is aware of the issue.
Read the entire ‘Troubleshooting Device Score Beta in ControlUp Dashboard’ thread below:
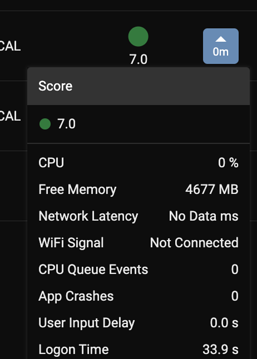
Any thoughts on why the Device Score Beta is 7 on the dashboard but 10 on the device view?
What is the interval for the graph? As far as I remember:
• The device overview dashboard is based on the latest 1 minute interval data point.
• The device details drill down will dynamically determine an interval. It could be 30 minutes, it could be 17, etc.
So long story short. Your device overview could be basing its data on a datapoint received at 11:34. Whereas the drill down may be based on a data point at 11:30, 11:20, 11:10, etc
device drill down was TODAY.
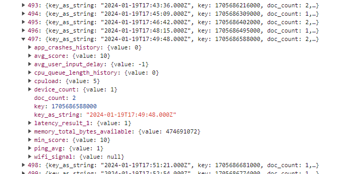
The graph data points aren’t set to absolute timestamps though. The timestamps to show are dynamically determined based on the time frame chosen. In my example, the interval between data points is 93 seconds.
With 93 seconds that means that I might get multiple raw data points in a single time window, therefor an average would be shown. Note how doc count on some of these shows 2. Meaning there were 2 raw data points for that time window.
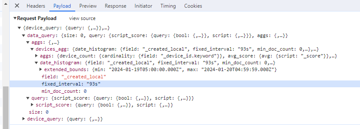
Bigger time windows, for example if Today was later in the day like your screenshot implies (8pm), means bigger windows, For example if I set my time window to yesterday midnight to yesterday 8pm. I get 173 second windows. And a bigger chance to have chart data points include multiple raw underlying data.


not sure I follow. The main devices dashboard doesn’t appear to have a time frame. I have 1 device with a score of 7 and when i drill down in to it it shows 10 for multiple short date ranges.
does it show 10 when you drill in to the score so only a handful show?
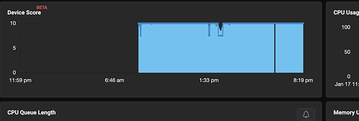
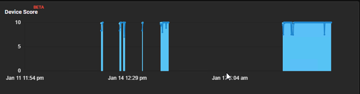
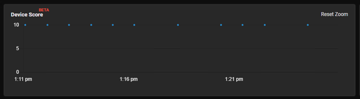
macro view:
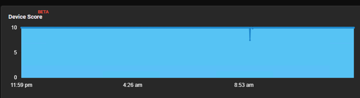
Micro View:
I mean really zoomed in so there’s only a few data points in the graph
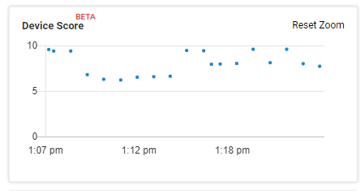
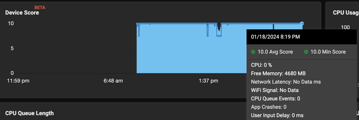
super micro view:
looks like the drill down doesn’t take logon duration into consideration.
while the overview does
interesting
@member
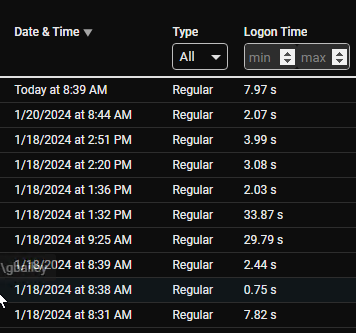
Still says 7.0 even though my last 2 logins were

The tooltip on the score should give you all the components that contribute to the score. Whats the difference?
PS, I am talking to the PM for this feature about this. But do keep in mind that this is in beta
it looks like its hanging on to the 33 sec logging time from last week.
Continue reading and comment on the thread ‘Troubleshooting Device Score Beta in ControlUp Dashboard’. Not a member? Join Here!
Categories: All Archives, ControlUp Dashboards, ControlUp for Desktops