A user asked whether it was possible to automate the process of disabling maintenance mode on virtual desktops. Suggestions include marking the systems by using the eventlog, using registry keys for non-persistent systems, and using a local database. Citrix’s Load Index was mentioned as a simpler solution, and it was clarified that it uses CPU, RAM, and maximum user numbers to calculate the effective load. ControlUp Automation and Citrix Virtual Apps and Desktops Policy Settings were both suggested as useful solutions.
Read the entire ‘Automating the Disabling of Maintenance Mode on Virtual Desktops’ thread below:
We are using a trigger/action to put VDAs in maintenance mode when they reach a certain user count level. This is due to compute constraints and not wanting to overload the servers. (VDA Sessions >or=to:33 & Enables MM)
What I would like to do is write another action that then monitors that and disables maintenance mode, but ONLY on the systems that were put in MM from this alert and not other systems we put in MM manually for other reasons. Is this even possible? Would be real cool if we could 🙂
You’d have to mark the systems somehow. Typically I’d use the eventlog for this. But if these are non-persistent you could use a registry key, file or something like that as well
If you want to get really exotic you could keep the "local database" (for lack of a better word) with the state on a machine which you would run the script from. But this would add some complexity. I know that @member played around with this in the past (to keep track of servicenow ticket id’s I think)
“`$eventLogName = "ControlUp Repeat Triggers"
$id = 1000 ## Needs to be unique between use cases!
$threshold = 1
$timeframe = 24##hours
check how many events have been logged
$filterhash = @{logname="application";providername=$eventLogName;id=$id;starttime=([datetime]::Now.AddHours(-$timeframe))}
[array]$number = Get-WinEvent -FilterHashtable $filterhash
if($number.count -ge $threshold)
{
Write-Host "FOLLOW UP ACTION"
Stop-VM -ComputerName $env:COMPUTERNAME
Send-MailMessage -To "[alerts@example.com](mailto:alerts@example.com)" -From "[controlup@example.com](mailto:controlup@example.com)" -Subject "$($env:COMPUTERNAME) PVS cache issue" -Body "$($env:COMPUTERNAME) has been forced shut down due to a PVS cache issue"
}“`
I might be misunderstanding but isn’t this what the load index is for in citrix?
On paper it should be. Not sure how reliable it is. Citrix sometimes is a bit of a black box. But you’re right that that’s a metric that should give you that insight
Most of the time the simpler solutions are better. I would suggest setting this to 33 and being done with it. https://docs.citrix.com/en-us/citrix-virtual-apps-desktops/policies/reference/load-management-policy-settings.html#maximum-number-of-sessions
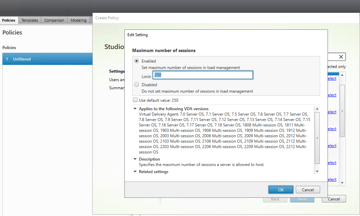
(Simpler solution on the surface anyway)
qfarm /load! 🙂
But yeah, set that to 33 and when it hits 33 this hits 10000 and the server stops taking on more users.
I had to play with a database to create ticket in service now only if something happened more than x times in the last y minutes (for example I don’t want a ticket if one user is having 500 ms latency but if more than 10, then I want a alert…)
But for this yes, Citrix is covering you 💯
I haven’t managed Citrix farms in years but I would suggest also adding in CPU and maybe memory into your load evaluator as well. Keeps users happy getting a truly least loaded server thats not just based on user counts.
True especially if your end users are very different (one can use autocad and another one notepad for example)
For published desktop with mostly the same usage, #users is good enough and easier to explain to helpdesk
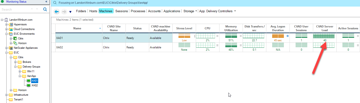
I am reading through these replies, but our load index uses CPU/RAM also in the evaluation so when I looked it is set to 100 users. If I lower this to say 33 users I think it would cause servers that are currently at a 9k load and immediately throw a 10k and I’d be in trouble. I think this is why we opted to use the trigger in CU
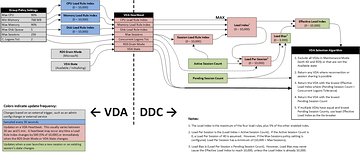
So if you put "33", it will means, that 1 user will represent around 3% of "load", you have CPU, RAM… The "effective load" is the max of all configured metric… (so if you have 5 users (15%), 20% of CPU, and 30% of RAM: the load will be 30%) The "user load" will become important when you have 30 users (90% of load). If you really want to stop at 33, then Citrix is the way to go
(even if I’m a huge fan of SBAs and CU Automation of course 😄
Not sure if my previous answer was clear enough: the metrics are not summed only one is used, the highest
1 user should be a CVAD Server Load of 303. 10,000/33=303. 🙂
"Most of the time the simpler solutions are better."
Yep, no moving parts with load evaluators. No scripts, no monitors, etc.
Continue reading and comment on the thread ‘Automating the Disabling of Maintenance Mode on Virtual Desktops’. Not a member? Join Here!
Categories: All Archives, ControlUp Scripts & Triggers