
This thread walks through a real customer question: how do you find which processes are eating the most CPU across a large VDI estate (200 servers) over a long period, so you know what to optimize?
It starts in ControlUp Dashboards. Using the VDI process data, you can build a widget showing top processes by CPU, then narrow it to the machines you care about using global filters (filter by folder, or switch to query filters with IS / IS NOT). A table beats a bar chart for a top-50 view, and any filters and time frames you set are saved in the URL, so you can bookmark or share the exact view. The built-in Gallery dashboards (notably "Big Screen Dashboard VDI") already include a processes-by-CPU widget out of the box.
The harder part is the one the customer really cared about: getting a meaningful picture across all machines rather than a single noisy spike on one box. The data is stored per process per 5-minute timeslot, not pre-aggregated per machine, so the practical approach that emerged was:
Filter to the folder containing all target machines.
Use CPU usage P95 to strip out short, expected spikes (with a fallback to average CPU, since P95 returned N/A in some environments — a possible bug worth a support ticket).
Add metrics under Advanced: computer_name (unique count) to see how many machines run the process, and process_name (count) to see how often it appeared (each record ≈ a 5-minute aggregate).
The processes worth optimizing are the ones combining high CPU + high machine count + high record count.
Worked example: a process showing ~1,080 records across 197 machines roughly translates to ~90 hours of activity over 7 days, or a few minutes per machine per day. The same method surfaced candidates like CompatTelRunner.exe, WerFault.exe, and WEM-related activity for further investigation. To go deeper, the App Trends and App Statistics reports let you drill into a specific app, and product_name data helps identify what's actually behind generic process names like setup.exe.
A few important caveats came up: averages hide spikes (10% average could be one minute at 100%), process counts are per machine, and hypervisor-level CPU (e.g., XenServer) can disagree with in-VM agent data when hosts are over-provisioned — which is also why a Sizing Recommendations report may suggest removing vCPUs even on a machine that looks maxed out.
Bottom line: use the dashboard to identify the heavy processes (folder filter + P95/avg CPU + machine count + record count), then use the App Trends report to dig into the details per app.
Read the entire article here...
Google Chrome Related Training & Support Archives
Google Chrome training and support-related archives from inside the ControlUp Community on Slack.
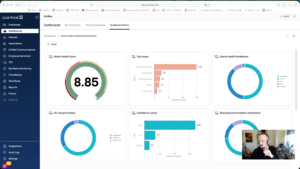
Widget Wednesday #18: New Filter UI and Unified Filtering Experience
Widget Wednesday #18 introduces a redesigned filter UI in ControlUp Dashboards with expanded filtering options, unified variables and filters, and improved usability for faster, more flexible data analysis.
Read the entire article here...
Read the entire article here...
Troubleshooting High CPU Utilization on ControlUp.
A user was unsure how to interpret the value 190% in a discussion with @member. @member recommended providing more hardware and CPU details for further investigation. It was later discovered that the issue was due to agent deployment with multiple devices reporting under the same ID, causing the CPU load event to be summed up incorrectly. The post serves as a helpful reference for others experiencing a similar issue.
Read the entire article here...
Read the entire article here...
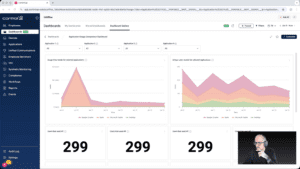
Widget Wednesday #8: Comparing Application Usage the Right Way
In this episode of Widget Wednesday, Chris Twiest walks through the Application Usage Comparison Dashboard from the Dashboard Gallery, focusing on how the full dashboard works together to turn raw usage data into meaningful, actionable comparisons inside ControlUp.
Read the entire article here...
Read the entire article here...
Troubleshooting ControlUp Academy Registration Issues
A user had trouble registering for ControlUp Academy and reached out for support. Another user suggested lowering browser security settings or disabling DNS-ad blockers may help. It was also mentioned that using a personal computer outside of the corporate network allowed for successful registration. The Academy provides valuable webinars and training for potential use cases. General information can be found at https://cuacademy.controlup.com/
Read the entire article here...
Read the entire article here...
Troubleshooting Chrome in a Citrix Environment: The “Sad Chrome Icon” Issue Explained
There have been reports of Google Chrome failing to load in Citrix environments, resulting in a "sad Chrome icon." This is due to a conflict between Chrome's sandbox security feature and the Citrix virtual environment. Running Chrome with the -no-sandbox command-line switch may fix the issue, but it is not recommended for a production environment. Instead, updating Chrome and Citrix components, configuring group policy objects, and checking third-party software may resolve the issue. It is also recommended to properly handle Chrome's user profile data using a Citrix Profile Management solution.
Read the entire article here...
Read the entire article here...
Changing Time Zones on the DEX Console
A user asked for advice on changing the time zone on the DEX console. It was noted that the console uses the browser's time zone and cannot be overridden, however, most browsers allow for temporary changes through the developer tools. The specific steps for Chrome were provided, with an example of how this would affect the online devices chart.
Read the entire article here...
Read the entire article here...
Issue with Page Refresh on Secure DX
Several users reported experiencing a page refresh every 30 seconds on Secure DX, even when Auto-Refresh was not enabled. Some users tested on different tenants and found that the refresh only occurred with Auto-Refresh enabled. After some troubleshooting and guidance from @member Joel, it was discovered that using the "empty cache and hard refresh" option in developer tools could fix this issue. It appears the refresh was caused by items left in local storage.
Read the entire article here...
Read the entire article here...
Finding Solutions for Password Management in ControlUp
A discussion took place on using a PAM product and Edge DX together, with one user mentioning issues with copying and pasting passwords at login and UAC prompts in ControlUp. Another user suggested checking browser clipboard settings, and it was also noted that this issue is a backlog item under review by ControlUp. A UserVoice request was shared for tracking purposes. It was also discussed that using LAPs and an Elevated Cmd session may be potential workarounds. Lastly, an AutoHotKey script was mentioned as a possible solution for a better experience for techs. The cited link can be found at https://support.controlup.com/docs/submit-and-vote-on-feature-requests
Read the entire article here...
Read the entire article here...
Inquiring About Browser Performance Monitoring for Real Time DX
A user asked for more details about Browser Performance Monitoring for Real Time DX, specifically asking if metrics for CPU and Memory would be displayed. The only article available provided limited information and listed metrics such as Browser URL Domain, Browser URL, and Browser Tab Title. Another user briefly looked at it and observed that Chrome would appear multiple times, with the resources consumed by each tab listed.
Read the entire article here...
Read the entire article here...