A user is experiencing frame buffer bottlenecks on their Horizon VDI machines with vGPU. They notice a high load in the machine view but all processes seem to be at 0% or N/A. Another user suggests checking system-owned processes and recommends looking at both PerfCounters and Nvidia SMI. There is an open bug for this issue, ado #298634.
Read the entire article here...
GPU Related Training & Support Archives
GPU training and support-related archives from inside the ControlUp Community on Slack.
Combining Metrics in ControlUp Widgets
A user asked if it is possible to combine two metrics in one graph, as they currently have three separate widgets. The response states that one aggregation is currently supported with the normal builder, but additional aggregations can be added through the expert builder. This option requires knowledge of configuration code and is best used with a table widget. The user expresses their willingness to try the advanced editor.
Read the entire article here...
Read the entire article here...
How to Retrieve Device Scores Through ControlUp’s API
A discussion on pulling device scores through automation in ControlUp's API took place. An employee suggested a script for doing so at the given URL, as an alternative to using employee scores. The user testing this found a limitation in the number of devices returned, which was addressed by a team member. The method is trapped before it can be lost. Score!
Read the entire article here...
Read the entire article here...
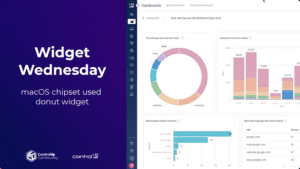
Widget Wednesday #1: Visualizing macOS Device Inventory with Donut Graphs
In this first episode of Widget Wednesday, we kick off a new video series focused on practical, real-world dashboard widgets you can build directly inside ControlUp.
Read the entire article here...
Read the entire article here...
Investigating Bogus Framebuffer Memory Usage with ControlUp
A user reported experiencing strange values in framebuffer memory usage for certain processes in a customer's Citrix environment with NVIDIA L4-4Q. They discovered that this issue can be caused by a broken Citrix XenDesktop graphics driver and was able to fix it by uninstalling and reinstalling the VDA. This issue has also been observed by Microsoft, who have a similar issue with GPU process memory counters reporting incorrect values. A support ticket has been opened for this issue and the ControlUp community has also seen similar cases.
Read the entire article here...
Read the entire article here...
Troubleshooting W365 CPC Integration and Visibility Issues
A group of ControlUp members discuss issues with the integration between W365 CPC and HDX. They note that EdgeDX does not detect brokering of a Cloud PC session, but the current configuration does show access to TURN and use of UDP. The group mentions that this may be due to the VDA configured on the device. There is also mention of potential confusion around which agent to use for the CPC Desktop, and a suggestion to pull a query to track the number of CPCs with a VDA installed and see what is reported. It is noted that there is interest from established enterprises to go this route.
Read the entire article here...
Read the entire article here...
Troubleshooting Strange GPU Usage in ControlUp’s Process and Machine Views
A user posts a question about their freshly installed environment and the strange GPU usage data they are getting from ControlUp. They provide details about their settings and ask for assistance in determining if the NVIDIA API is causing the issue. Other users suggest checking for shared memory usage and provide instructions on how to do so.
Read the entire article here...
Read the entire article here...
Troubleshooting vGPU Metrics with ControlUp
A discussion took place about vGPU metrics and how they differ depending on whether Windows or Nvidia API is used for data collection. One member asked for tips on making data collection via Nvidia API work and another member suggested checking for the installation of NVIDIA WMI and restarting the ControlUp agent after switching. ControlUp documentation on vGPU can be found at https://support.controlup.com/v1/docs/gpu-monitoring-with-controlup#collecting-data-from-nvidia-api-optional.
Read the entire article here...
Read the entire article here...
ControlUp Community Radio Episode #7 – Conversation with Ryan Ververs-Bijkerk & Eltjo van Gulik from Go-EUC.com
In Episode #7 of ControlUp Community Radio, Douglas Brown interviews Ryan Ververs-Bijkerk and Eltjo van Gulik from Go-EUC.com. This podcast delivers an in-depth view of end-user computing (EUC), focusing on the contributions and discoveries of GO-EUC, as well as a thorough examination of user experience and remoting protocols like HDX and ICA.
Read the entire article here...

Read the entire article here...
Troubleshooting High Peak User Input Delays in ControlUp
A user asked for recommendations to diagnose high Peak User Input Delays. Another user suggested zooming in on the time of the delay and checking memory usage. They also shared how to find information on what application is slow to respond to user input. The discussion then focused on how to identify the cause of a slow application, often due to resource constraints. The team provided examples, such as MMCexe processing event logs, and suggested that more resources may not always solve the issue.
Read the entire article here...
Read the entire article here...