After discussing how to initiate a tracert when high latency is detected, a user suggested setting an alert based on the _devices index and using a script to run the tracert and log the data into a custom index. However, it was noted that tracert results may not always show the culprit. A screenshot was attached as an example and it was suggested to have a threshold that triggers a tracert viewable from the UI directly on the endpoint. It was also mentioned that the samples seen in the graph are per minute, so there may have been an ongoing issue.
Read the entire ‘Initiating a Tracert for High Latency Detection in ControlUp’ thread below:
How could I get a tracert to kick off when there is high latency detected? The set interval its at now often misses it either just before or just after so the tracert doesn’t help at the time of the reported issue. Hope that makes sense.
You could set an alert for the _devices index on the latency column >= whatever. As a followup action run a script that runs the trace route and throw the data into a custom index.
No other way to get it to show up in the UI like the predefined ones would?
Not in a nice graph.
Just to mention here. We already do a tracert every 15 minutes for all Latency targets set up in the config. AND! Tracert is calculated completely different than a ping test. You might not now where in the netwerk the issue lies. This is also because when I ping now. And do a tracert immediately after, there is no gaurantee that you can see that latency in the tracert.
The tracert tends to land just before or after the actual event, so from a tracert perspective everything looks dandy and in between it there are marks for high latency.
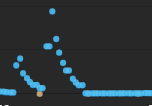
Not a great example but attached a screenshot of what I mean. The tracert results show "everything is fine" but there WAS almost 1000ms of latency for some reason just after it.
It’d be a thought to have a threshold that if met triggers a tracert that is viewable from the UI directly on the endpoint like the others. From our helpdesk perspective they need to be able to see these things quickly to relay information and not digging through reports or data indexes.
But still. If you tried a tracert within a second, there is no guarantee you will find the culprit in the tracert.
The samples seen in the graph are per minute so chances are there was an ongoing issue. My recommendation above is still valid, just doesn’t make a graph for you without API calls or PowerBI.
Continue reading and comment on the thread ‘Initiating a Tracert for High Latency Detection in ControlUp’. Not a member? Join Here!
Categories: All Archives, ControlUp for Desktops, ControlUp Scripts & Triggers