A discussion on memory utilization in the machines in a container within the ControlUp web GUI. One user suggests sending the issue to the manager to showcase the value of memory hardware. Another user mentions that all individual machines appear to be "green" but there is a discrepancy between the fat client and web GUI. The issue is resolved after restarting the monitor servers.
Read the entire ‘Troubleshooting Memory Utilization in ControlUp Web GUI’ thread below:
i cant recall where this issue comes from or how to fix?
Send it to your manager, show them how much value for money they’re getting in terms of memory hardware 😉
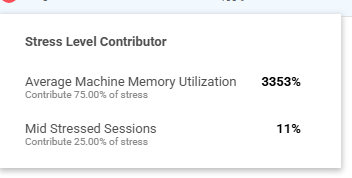
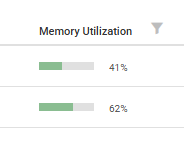
Jokes aside, can you drill down and see what the memory utilization is for the machines in that container? Any of them stand out with ridiculous numbers?
nothing i can see. each individual machine is "green"
it appears to be only an issue in the web gui. fat client controlup doesnt show the delivery group as stressed at all. odd
yeah there is a wide disconnect between stress in fat client and web in my entire environment.
looks like it may have resolved with our old time favorite fix "restart monitor servers’
Continue reading and comment on the thread ‘Troubleshooting Memory Utilization in ControlUp Web GUI’. Not a member? Join Here!
Categories: All Archives, ControlUp for VDI