
A user reported an issue on the ControlUp Unified Communications Dashboard, specifically with the "Amount of devices" metric displaying an error message stating "Something went wrong." The problem was identified within the dashboard gallery, not a customized or private dashboard.
Investigation revealed that the user's environment involved Teams integration only, without Zoom integration. Other users confirmed the feature worked correctly in their setups, suggesting the issue might be isolated or related to specific configuration parameters.
One recommended troubleshooting step was to review and reselect the data index used by the widget, as this action had previously resolved a similar issue with another widget. The suggestion included taking screenshots of the current configurable settings to restore them if necessary since reselecting an index can reset other dashboard settings. This resolution approach highlights the importance of verifying the correct data source or index selection when dashboard widgets fail to display expected information.
Although the issue was not fully resolved within the discussion, the key takeaway is ensuring the widget’s data index aligns properly with the intended source. Administrators encountering similar errors on the Unified Communications Dashboard are advised to confirm their integration settings and, if problems persist, reconfigure the widget's data index while preserving current configuration parameters.
For further guidance, see ControlUp’s official documentation on dashboard configuration and index management at https://docs.controlup.com.
Read the entire article here...
ControlUp Dashboards
How to Identify and Manage Duplicate Devices in ControlUp Desktops Due to Reimaging and Agent Re-registration
A common challenge with ControlUp's Desktops product arises when IT teams test new device models by repeatedly reimaging machines, causing multiple instances of the same device to register with unique device IDs but identical hostnames. This scenario leads to an inflated license count, as each registration consumes a license until the devices are flagged inactive and subsequently removed from the system.
To identify these "duplicate" devices, one effective method involves querying the ControlUp `device_status` data index. While leveraging ControlUp Dashboards can help visualize this data, caution is advised when running queries based solely on device IDs without applying appropriate filters to avoid misleading results. Advanced options in the dashboard allow adding additional metrics that can pinpoint such duplicates by hostname or device name, which is particularly helpful since the root issue is not duplicate device IDs but duplicate device names retained after reimaging.
In practice, customizing dashboard widgets with additional filters and metrics can enable teams to monitor and isolate devices that have been repeatedly reimaged and registered, streamlining license management. For devices already deployed, it is possible to run a script that forces re-registration of devices with a new unique ID to prevent license count inflation. This step may be beneficial where device IDs need to be refreshed or reset in the ControlUp environment.
Another important factor involves deployment parameters. For example, the `REGISTERWITHNAME=1` flag, if set during agent deployment, can cause devices to register under the same name, exacerbating duplicate name issues. However, in many cases, the default setting with the `ALLUSERS=1` flag, used in ControlUp's standard installer from the Downloads pane, is sufficient and does not trigger duplicate registrations unless devices are repeatedly reimaged and reset by users.
Overall, the underlying cause of the inflated license usage is the repeated device reimaging and agent re-registration under the same hostname but with unique IDs. Proper use of the `device_status` index for querying, cautious dashboard configurations, potential scripting to reset device IDs, and awareness of deployment flags can effectively manage and mitigate "duplicate" device issues within the ControlUp Desktops product.
Read the entire article here...
Read the entire article here...
Enabling FSLogix Metrics on ControlUp Dashboards Using Real-Time Data and Upcoming API Enhancements
ControlUp users have inquired about displaying FSLogix metrics on the ControlUp Dashboard, but encountered the limitation that no predefined FSLogix metrics are currently available in the existing data scopes. This is because FSLogix real-time data is not currently included in ControlUp’s historical data sets, which underpin the dashboard's metric options and the public API. As a result, FSLogix metrics are not accessible through these channels at present.
ControlUp’s product management and development teams have confirmed that this situation is expected to change soon. There is an upcoming Real-time public API planned for release that will include FSLogix real-time data. This update will enable users to access FSLogix metrics on dashboards in real time, expanding the ability to monitor FSLogix environments directly within the ControlUp interface.
In parallel, ControlUp is also working on extending real-time data access for its AI Assistant functionality. Once implemented, this will allow users to generate dynamic visuals and analyses on FSLogix data using the AI Assistant, further enhancing real-time monitoring and troubleshooting capabilities related to FSLogix.
For now, users cannot directly add FSLogix metrics to dashboards due to the absence of these metrics in the historical data and public API. However, the forthcoming updates will bridge this gap, allowing seamless integration of FSLogix metrics into ControlUp’s real-time dashboards and AI-driven analytics. For further information on ControlUp dashboards and the evolving capabilities, users can refer to the official documentation at https://docs.controlup.com and the ControlUp Academy at https://cuacademy.controlup.com.
Read the entire article here...
Read the entire article here...
Understanding macOS Crash Reporting in ControlUp 2.18 through the Windows Event Log Data Source
Starting with version 2.18, the ControlUp agent introduced a new feature that captures macOS crash reports in a manner similar to how Windows crash events are reported. Specifically, macOS crash events are logged into the `win_event_log` data source. Despite the name suggesting Windows-specific logs, the `win_event_log` was retained for these macOS crash reports to maintain compatibility with existing dashboards, reports, and other analytics tools that use this data source.
In the `win_event_log`, macOS events can be identified by the `platform` column, which uses the value 2 to represent macOS. This mechanism allows users to distinguish between Windows and macOS crash events within the same log. It's important to note that prior to version 2.18, the `platform` column was either absent or not used for such differentiation because macOS crash reporting was not implemented in this way. If the `platform` column is missing in your index, it likely means no macOS crash reports from version 2.18 or later have been collected yet.
When creating dashboards or queries to analyze these logs, you cannot filter on `os_name` with the expectation that macOS events will appear under Windows Event Log sources. Instead, you should query the `win_event_log` but use the `platform` column to separate macOS crash events from Windows ones. This approach leverages the backward compatibility of the log source naming while correctly distinguishing between operating systems in your monitoring views.
For more detailed guidance on working with macOS crash reports and the implications of their integration in the `win_event_log`, refer to ControlUp’s official documentation and the release notes for version 2.18. These resources offer comprehensive information about this feature and best practices for its usage.
Read the entire article here...
Read the entire article here...
Troubleshooting AI Query Errors for Connection Failure Metrics and Using ControlUp Dashboards as an Alternative
A user encountered difficulties querying connection failure data within a specified time range using the ControlUp AI assistant. Despite attempting a straightforward query to count connection failures during a certain period, the AI repeatedly generated errors instead of delivering the requested information. This issue highlighted limitations or temporary glitches in the AI interface for composing complex filter criteria involving time intervals.
Upon reporting the problem to the ControlUp support team, it was acknowledged as potentially related to recent network issues, which may have contributed to the AI malfunction on the previous day. The team requested formal feedback submission to investigate the problem further and verify if it could be reliably reproduced under similar conditions.
In the meantime, a practical alternative was suggested from within the community: a pre-built Citrix connection failures dashboard created by a peer user. This dashboard presents connection failure metrics in an organized and visually accessible format, allowing administrators to monitor relevant data without relying solely on raw AI-driven queries. Such dashboards provide easier insights into connection issues and can be a more reliable solution for identifying failure trends over time.
For users experiencing similar problems with AI query errors related to connection failure data, exploring the ControlUp dashboard options is recommended as an effective workaround. Additionally, reporting such AI issues to ControlUp support ensures ongoing improvement of AI capabilities for querying monitoring data. More information on creating and customizing monitoring dashboards can be found in the ControlUp Knowledge Base at https://docs.controlup.com and tutorials at the ControlUp Academy https://cuacademy.controlup.com.
Read the entire article here...
Read the entire article here...
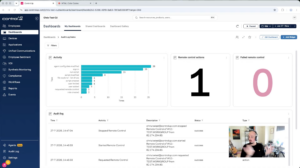
Widget Wednesday #25: Building Dashboard Widgets with Audit Log Data
This week’s Widget Wednesday introduces a new data source for ControlUp Dashboards: the Audit Log.
Read the entire article here...
Read the entire article here...
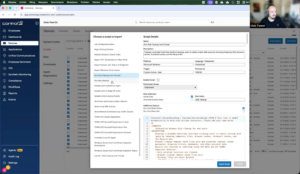
NEW ControlUp Disk cleanup script that actually asks the user what to delete
Chris Twiest demos a new interactive disk cleanup utility built by Sebastien Perusat and now baked into the product. Instead of silently cleaning from the system context, it prompts the end user with what can be reclaimed and lets them choose — recycle bin, temp files, browser cache. Works on Windows and macOS, can be triggered manually or from an alert, writes results to a data index and a device event, and is fully editable. Available in the script library now.
Read the entire article here...
Read the entire article here...
How to Preserve Static Filters When Copying ControlUp Dashboards
In ControlUp dashboards, users may desire to create copies of a dashboard with pre-set filters that remain consistent and "locked" across multiple instances or devices. However, a limitation exists in that filters on copied dashboards reset to default values rather than preserving the original filter settings. This is because filter states are saved within the URL, allowing users to copy or bookmark filtered views.
At the time of the inquiry, a reported bug prevented these filters from automatically restoring when a dashboard was copied or opened from a saved URL. This issue affected workflows where multiple dashboard copies were needed with static filter criteria for consistent monitoring or reporting. ControlUp acknowledged the bug and targeted a resolution by mid-August.
The issue has since been resolved, enabling filters to properly restore from the URL when duplicating or accessing dashboards. While users can facilitate quick filter selection with variables, the fix now ensures filter states remain persistent as intended when copying dashboards, thus supporting more effective and static customized dashboard scenarios.
For further details on dashboard filter functionality and managing variables, users can refer to the ControlUp Knowledge Base and related documentation available at https://docs.controlup.com. The ability to save and restore filter states enhances dashboard usability, particularly in environments requiring consistent monitoring views across multiple devices or team members.
Read the entire article here...
Read the entire article here...
How to Calculate Time Saved from Automation Runs in ControlUp Dashboards Using Calculated Metrics
A user sought to create insights on time saved through automations by modifying the existing scripting and automation dashboard in ControlUp. Their goal was to add a calculated column that multiplies the number of successful script runs by a fixed value (such as 5 or 10) to estimate the total minutes saved. The user attempted to apply a mathematical transformation—specifically multiplying the "success-runs" metric by 10—via the dashboard's JSON transformation editor. However, they encountered difficulties as the table widget was built using the advanced JSON builder, which does not support switching to the basic editor mode where simple calculated columns can be added or modified directly.
ControlUp's community and support experts explained that the particular widget in question is created through the advanced JSON editor and does not support adding custom calculated columns directly on individual tables. The system currently does not allow adding a calculated column that multiplies existing columns in the advanced editor since it applies transformations to each column rather than enabling column-to-column calculations.
A recommended workaround is to use the associated "stat" widget found elsewhere on the same dashboard. This widget provides basic aggregated metrics and allows users to add simple calculations, such as multiplying the total number of successful script runs by a fixed number to calculate total time saved. By performing the multiplication in the stat widget rather than modifying the complex JSON table, users can achieve their insight goal effectively.
This limitation highlights that for advanced dashboards created via JSON editing in ControlUp, calculated columns that depend on arithmetic of existing columns must be created through simpler widgets or by recalculating the data outside the table visualization. Users aiming to customize time-saving metrics based on script run counts should consider leveraging stat widgets or other summary-level visualizations that support straightforward calculated metrics. For further guidance, ControlUp's official documentation on the dashboard widgets and calculations can provide additional instructions: https://docs.controlup.com/display/DOCS/Dashboards and https://docs.controlup.com/display/DOCS/Data+Transforms.
Read the entire article here...
Read the entire article here...
How to Implement Native macOS and Windows Self-Service Disk Cleanup via ControlUp Edge DX Without External Tools
A ControlUp community member developed a native self-service disk cleanup solution for macOS and Windows users, designed to be triggered via ControlUp Edge DX without requiring IT intervention or external tools. The goal was to allow users to safely free disk space through a simple, native dialog that displays current disk usage and offers a checklist of safe-to-clean areas such as Trash, application caches, container caches, logs, Xcode build cache, and old temporary files. Each item is described in plain language and sorted by the space it occupies, allowing users to select and confirm the cleanup themselves.
On macOS, the dialog is implemented using only built-in osascript capabilities—no additional tools like swiftDialog or extra installations are necessary. For both macOS and Windows, the solution emphasizes safety by running a dry-run by default, excluding critical system folders and personal directories such as Documents, Downloads, Keychains, and SSH keys from cleanup. The cleanup operates within the context of the logged-in user, not root, ensuring user-specific data protection. After cleanup, the system verifies the amount of space reclaimed against the actual free volume.
Triggering this cleanup from an Edge DX alert, either automatically due to disk usage thresholds or on-demand, enables a small dashboard that reports on reclaimable and freed disk space, all without requiring elevated permissions, Intune writes, or admin consent. One of the more challenging technical aspects was delivering the cleanup dialog from a root-level agent into the user’s session, given the restrictions of macOS and Windows environments.
The community member shared that while the script could likely be optimized or shortened by more experienced developers, this version works reliably and safely. Detailed setup documentation is available by request. Additionally, to complement the cleanup tool, the developer created an analytics dashboard to track the cumulative space saved by the script. This solution offers a practical way for organizations using ControlUp Edge DX to empower their end users with safe, controlled disk cleanup capabilities, minimizing helpdesk workload without compromising disk security or user privacy.
For more on creating and managing custom alerts and actions within ControlUp Edge DX, consult the official documentation at https://docs.controlup.com/edge and explore ControlUp Academy at https://cuacademy.controlup.com for training on extending ControlUp functionality.
Read the entire article here...
Read the entire article here...