The group discussed how to better understand the details behind CPU queue events in ControlUp for Desktops. Some suggestions included adding specific event IDs for collection and using the new active processes > threads view to identify threads waiting for CPU availability. Complications to consider include CPU spikes and threads changing state rapidly. Running a WPA CPU trace may provide a better understanding of thread queueing.
Read the entire ‘Improving Understanding of CPU Queue Events in ControlUp’ thread below:
Hi All,
Starting to do work on CPU Queue Events in CU for Desktops, to actually understand what is created a CPU Queue Event (Processes waiting for CPU availability), do we need to add specific event IDs for collection or what do we need to do to actually have better insights into the details behind queue events?
Follow
Bumb
I really would love the CU team to reply here 🙂
This is somthing that i / Support Guys are struggling with daily
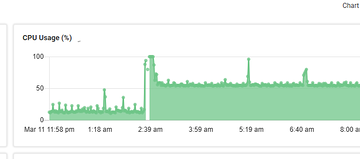
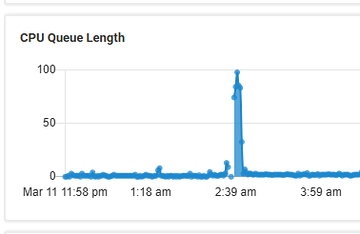
Generally speaking CPU queue is just too much work, not enough resources. Like in this case.
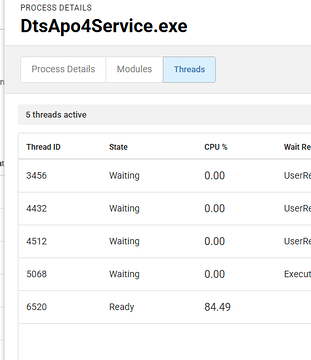
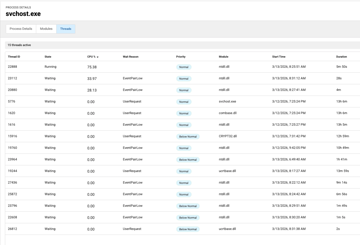
We don’t gather detailed data on the CPU queue at this point. But some things to consider is the new active processes > threads view. For example the 6520 thread is ready to execute, but there are no CPU resources available (or Windows isn’t scheduling the thread for some other reason).
Agree to what Dennis says.
In addition if you cannot identify it in ControlUp you probably need a WPA CPU trace and analyze it.
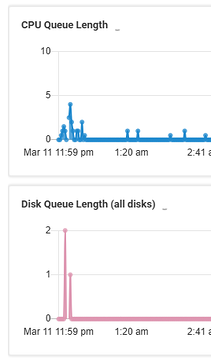
Another reason can be waiting for IO to complete. This is a bit more nuanced. As far as I’m aware, there is no immediate indicator. But you’ll likely see disk queue around the same time.
For example in this case. The CPU isn’t fully consumed. But there is still a CPU queue. And while I can’t say for sure. It is likely processes ready to execute if/when the disk IO completes
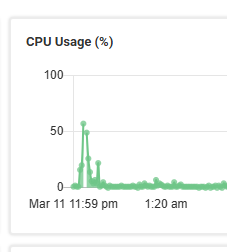
There are also other nuances to consider. Maybe the CPU isn’t at 100% but Windows won’t schedule a ready thread for some other reason. Maybe it is power management. Maybe it is that one CPU has capabilities that the other does not (performance vs efficiency cores). Maybe it is a affinity, maybe some process only wants to use the 1st core (very common)
I’m asking
If the CPU spike or CPU queue length happened earlier, the trace won’t contain that data. Running a trace on a device that is no longer experiencing the issue will mostly show normal activity and may not reflect the conditions that caused the spike in the first place.
@member @member What is this telling me ?

Nothing in those screenshots would (as far as I know) contribute to CPU queue.
Do note that CPU queue by looking at thread state can be tricky. As thread state can change very rapidly.
Something like a WPA CPU trace will show you how long a thread was in a ready state (waiting to be scheduled). That might be a better way to look at this
Continue reading and comment on the thread ‘Improving Understanding of CPU Queue Events in ControlUp’. Not a member? Join Here!
Categories: All Archives, ControlUp for Desktops