
Discussion about using ControlUp dashboards and the new features, including a request for multiple queries in a single time series and options for truncating strings in transformations. The team shares that multi-metric functionality is in the works and upcoming training on how to use advanced features within dashboards.
Read the entire ‘ControlUp Dashboards and Exciting New Features’ thread below:
Trying to learn dashboards better and do interesting things, but hitting a block with a time series and showing memory percent available and average usage in a single graph.
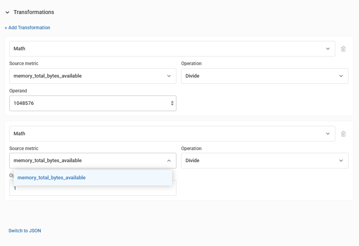
With the new features I can add them, but when it comes to transformations to move them into a more readable mb form instead of bytes and enormous numbers, I can only pick whatever metric I selected in the top area. The extra metrics from Advanced don’t show up for transformations.
Is that intentional?
Cc @member
High Mike, you don’t need transformations on the right side select unit family data and then base unit bytes !
We are working on multi metrics transformation and calculations too but they weren’t part yet of the new advanced section yet.
That will be huge for me when it happens.
Something else I would REALLY like to do in Dashboards, is multiple queries in a single time series.
I want to be able to see what parts of ControlUp are being used to be able to relay the value back to management (eventually by group, but not yet)
I’m using builtin_appdx_navigation and can absolutely get to the data I want, but it’s SO many widgits. I’d love to be able to have one per section, or an overall that in the same one would chart the daily pageloads.
The one I’m looking at right now is the devices section, so a wildcard on domain being controlup.com
but then where it currently falls short is a wildcard for /devices/ to show all the pageloads for the section. To me one of us going in and dashboarding is going to have a lot of hits on the index, but I want to be able to see those differently.
I want another that would be devices/devices then devices/reports devices/data (scripts or events) and devices/home
To do this now is 4 different widgets, when it could be one with different lines.
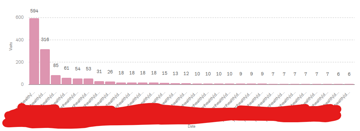
A transform which would let me truncate strings would also be amazing…
this isn’t ideal to look at
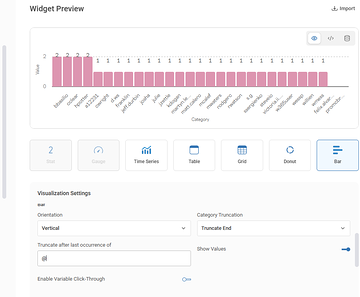
the truncate options should do that for you. For example with and without truncating on @ in my case
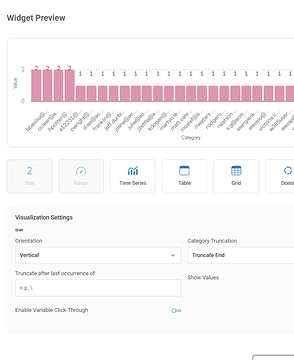
You’d want to truncate start and on /
any chance of truncating the ends as well as the beginnings?
some do device then what looks like a guid
I don’t think so. Not without additional functionality.
You can do multiple series though. In a few ways. By combining aggregations, groupby or even entire queries. For example a widget with 2 queries. 1 from device_status and 1 from app_focus.
The data doesn’t make a whole lot of sense. But it shows the capability.
You’d have to use the advanced editor though
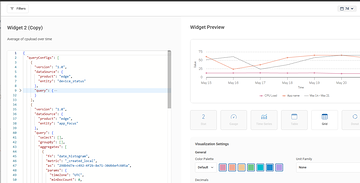
Okay, any trainings on how to use it well? the as parts don’t make the most sense yet to me.
No. I believe the intent behind the advanced editor is to give you access to more powerful, brute force almost, features. But the trade-off is that it isn’t documented or friendly in terms of UI support.
Yeah that’s now the JSON editor we do have an advanced section now in the builder which you can unfold and if you select a time serie you can just click on +add metric and add up to 4 extra metrics in your time series !
Which is a former "json editor only" feature moving into the UI, right? Multi-aggregations
Which is kind of the point of the JSON editor. For the team to give expert users access to features without having to add UI support to it (yet).
Next widget Wednesday will be over multi metric part ! And yes it’s in the UI now
Continue reading and comment on the thread ‘ControlUp Dashboards and Exciting New Features’. Not a member? Join Here!
Categories: All Archives, ControlUp Dashboards, ControlUp Scripts & Triggers