The ControlUp team discussed dashboard options for monitoring machines and identifying ones that need attention, with a suggestion to use PowerBI. It was noted that data can be exported using the streaming API and instructions for this can be found at https://api.controlup.io/reference/how-to-create-api-keys.
Read the entire ‘Finding the Right Dashboard for Monitoring with ControlUp’ thread below:
what do you all use for Dashboards? Do you actually use the ControlUp dashboard functionality? I am looking to have a view that shows all machines in the environment that are showing as DOWN as well as machines that are Unregistered in Citrix Studio
Hello Josh,
We have a Citrix Dashboard example in our lab. Is this what you are looking for?
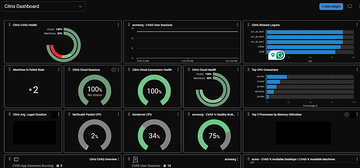
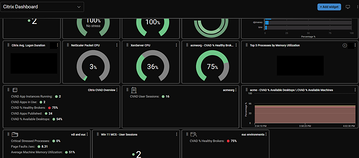
more like this
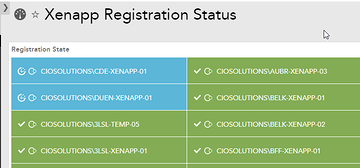
just a dashboard showing what is red and needing attention
Ah ok gotcha. I’m thinking more PowerBi for this kind of layout then.
can you dump into powerbi??
Yes you can. You can export the data using our streaming API and import it to get what you need.
https://api.controlup.io/reference/how-to-create-api-keys
Continue reading and comment on the thread ‘Finding the Right Dashboard for Monitoring with ControlUp’. Not a member? Join Here!
Categories: All Archives, ControlUp Dashboards, ControlUp for VDI