A user inquired about zooming in on the CPU Utilization graph within the Reports -> Session Activity report for VDI. Another user shared that clicking and dragging on the graph will zoom in on the desired time period. This was found to be easier than expected.
Read the entire article here...
CPU Related Training & Support Archives
CPU training and support-related archives from inside the ControlUp Community on Slack.
Improving Understanding of CPU Queue Events in ControlUp
The group discussed how to better understand the details behind CPU queue events in ControlUp for Desktops. Some suggestions included adding specific event IDs for collection and using the new active processes > threads view to identify threads waiting for CPU availability. Complications to consider include CPU spikes and threads changing state rapidly. Running a WPA CPU trace may provide a better understanding of thread queueing.
Read the entire article here...
Read the entire article here...
Widget Wednesday #12: Introducing Grid Viewer for Raw Data Exploration
This week’s Widget Wednesday introduces a powerful new widget type in ControlUp Dashboards, the Grid Viewer.
Unlike traditional widgets that summarize data through averages, totals, or grouped metrics, the Grid Viewer gives you direct access to raw data. It’s designed for situations where you want to see exactly what’s happening under the hood and shape the view around your specific needs.…
Read the entire article here...
Read the entire article here...
Addressing Timestamp Issues in ControlUp’s PowerShell Cmdlet Invoke-CUQuery
A user is experiencing an issue with the PowerShell cmdlet Invoke-CUQuery and discusses it in a Slack conversation with @members. They expected a timestamp to change whenever a value changes, but this is not the case. They share a screenshot of the issue and mention their understanding of the documentation. Another user explains that whenCreated reflects when a computer record was created in the internal database and gives a recommendation for a better approach. The original user shares their use case for needing a timestamp that shows when a record was last changed, but is informed that this data is not currently available. Other potential solutions and a discussion take place.
Read the entire article here...
Read the entire article here...
Understanding CPU Max in ControlUp Performance View
A user asked for clarification on the CPU utilization graphs in the User Session Details / Performance view. Another user explained that the CPU Max graph shows the highest 3-seconds sample during a 5-minute period, which can cause spikes of 100% even if the host and user CPU numbers are only at 10%. The original user was directed to the documentation for further explanation.
Read the entire article here...
Read the entire article here...
Upcoming Feature: Improved Sizing Recommendations in ControlUp
The "Sizing Recommendations" report is currently using the past 30 days of data, showing usage even during inactive hours. A user suggested implementing an option for only tracking business/active hours to accurately size machines. Another user stated that this feature is upcoming and development and testing have already finished, and deferred to a third member's knowledge on the release date.
Read the entire article here...
Read the entire article here...
Sorting issue in ControlUp affecting Machines (VDA) view
Some users are experiencing an issue in ControlUp where sorting by table headings is not possible. This issue seems to only affect the "Machines (VDA)" view and does not occur in the "Sessions" view. Some users have found that recreating their custom views can be a workaround for this issue.
Read the entire article here...
Read the entire article here...
ControlUp’s Options for VDI Utilization Reports and Dashboards
A customer has requested a high-level overview of VDI utilization over a specific period, categorized by VDI class and possibly department. ControlUp's console and VDI REST API can be used to generate customized reports and dashboards, while new updates are being made to include VDI data in existing dashboards. Further discussion includes suggestions for using the API to create custom reports and importing data into other tools. Some existing reports, such as the Session Count report and session activity report, can also provide relevant data.
Read the entire article here...
Read the entire article here...
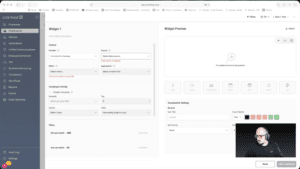
Combining Metrics in ControlUp Widgets
A user asked if it is possible to combine two metrics in one graph, as they currently have three separate widgets. The response states that one aggregation is currently supported with the normal builder, but additional aggregations can be added through the expert builder. This option requires knowledge of configuration code and is best used with a table widget. The user expresses their willingness to try the advanced editor.
Read the entire article here...
Read the entire article here...
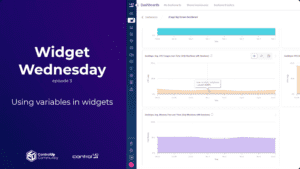
Widget Wednesday #3: Building Dynamic Dashboards with Variables
In this episode of Widget Wednesday, Chris Twiest takes a deep dive into variables and how they can transform ControlUp dashboards from static charts into dynamic, data-driven visualizations inside ControlUp.
Read the entire article here...
Read the entire article here...