Chris Twiest demos a new interactive disk cleanup utility built by Sebastien Perusat and now baked into the product. Instead of silently cleaning from the system context, it prompts the end user with what can be reclaimed and lets them choose — recycle bin, temp files, browser cache. Works on Windows and macOS, can be triggered manually or from an alert, writes results to a data index and a device event, and is fully editable. Available in the script library now.
Read the entire article here...
ControlUp Agent Related Training & Support Archives
ControlUp Agent training and support-related archives from inside the ControlUp Community on Slack.
How to Auto Log Off Idle Users in Azure Virtual Desktop Using ControlUp Triggers and Scripts
Several ControlUp community members discussed how to configure a trigger to automatically log off idle users from Azure Virtual Desktop (AVD) hosts using the ControlUp Agent for Virtual Desktop Infrastructure (VDI). One common solution is to leverage existing trigger packs within ControlUp, which include triggers designed to log off a user session after a specified period of inactivity. These triggers can be customized based on time thresholds that fit the organization’s session management policies.
An example script and detailed guidance were shared from ControlUp’s official script library, which provides automation for disconnecting or logging off idle sessions. This script can be adapted and deployed within ControlUp's automation policies to monitor session activity and log off users automatically when idle thresholds are met. The relevant resource is available at https://www.controlup.com/script-library-posts/disconnect-or-log-off-idle-sessions/.
Additional insights were shared from a ControlUp blog post that focuses on session resource optimization through automation. This post outlines best practices and practical examples of using ControlUp automation to manage session states efficiently, including auto-logout for idle sessions. The blog can be found here: https://www.controlup.com/blog/controlup-automation-session-resource-optimization/.
While native solutions like DaaS IQ might offer built-in functionality for auto-logging off idle users, many organizations have adopted ControlUp triggers as a practical workaround until formal approval or integration of native options is completed. The combination of ControlUp’s flexible triggers and scripting capabilities allows administrators to enforce session timeout policies effectively within AVD environments, optimizing resource utilization and enhancing security.
Read the entire article here...
Read the entire article here...
How to Use ControlUp’s Beta Features for Desktops: Deployment, Benefits, and Best Practices
ControlUp has introduced new beta features for its ControlUp for Desktops agent, offering users early access to the latest enhancements and improvements. This beta version is designed to allow IT administrators and users to test new functionalities before they are released for general availability. To participate in the beta, users can configure their agent version control settings to deploy the beta version selectively across specific devices. This targeted deployment helps organizations evaluate the beta features in a controlled environment without impacting their entire infrastructure.
The update has been well-received by the community, highlighting the significant value and innovation brought by the new capabilities. The positive feedback underscores the quality and effort invested by the development team in enhancing the user experience and functionality of the ControlUp agent. Although detailed specifics of the beta features were not outlined in the initial announcement, users are encouraged to review the beta release notes and experiment with the new version in their test environments to understand the full scope of improvements.
As this version is a beta, it is important to note that it may contain experimental features or potential issues not present in stable releases. Organizations should exercise caution by limiting beta deployment to non-critical systems or test groups, monitoring performance, and providing feedback to ControlUp to assist in refining the final release. Users can manage agent versions and access version control documentation at https://support.controlup.com/v1/docs/agent-version-control to ensure proper deployment and rollback options are understood.
For further information on ControlUp agent management, deployment best practices, and how to leverage new updates effectively, consulting the official ControlUp documentation at https://docs.controlup.com and the ControlUp Academy at https://cuacademy.controlup.com is recommended. These resources offer comprehensive guidance on everything from installation to advanced feature configuration, ensuring IT teams maximize the benefits of ControlUp across their digital workplaces.
Read the entire article here...
Read the entire article here...
ControlUp Community Meetup 15: How to: Connecting MCP AI to your Real-Time Data
Learn how to connect AI to live enterprise data using the ControlUp MCP Server. In this session, Chris Twiest explains the fundamentals of Model Context Protocol (MCP), including LLMs, prompts, system prompts, tool calling, and retrieval, before demonstrating how to connect Claude Desktop to ControlUp. Watch a live walkthrough of configuring the MCP Server, querying real-time endpoint data, visualizing application crashes, comparing results against historical baselines, and using system prompts to dramatically improve AI accuracy. The session also explores practical use cases, including upgrade planning, combining multiple MCP servers, building custom AI interfaces, and the future of autonomous endpoint management.
Read the entire article here...

Read the entire article here...
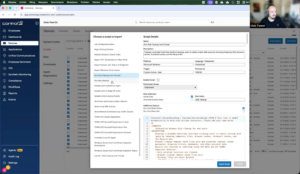
How to Implement Native macOS and Windows Self-Service Disk Cleanup via ControlUp Edge DX Without External Tools
A ControlUp community member developed a native self-service disk cleanup solution for macOS and Windows users, designed to be triggered via ControlUp Edge DX without requiring IT intervention or external tools. The goal was to allow users to safely free disk space through a simple, native dialog that displays current disk usage and offers a checklist of safe-to-clean areas such as Trash, application caches, container caches, logs, Xcode build cache, and old temporary files. Each item is described in plain language and sorted by the space it occupies, allowing users to select and confirm the cleanup themselves.
On macOS, the dialog is implemented using only built-in osascript capabilities—no additional tools like swiftDialog or extra installations are necessary. For both macOS and Windows, the solution emphasizes safety by running a dry-run by default, excluding critical system folders and personal directories such as Documents, Downloads, Keychains, and SSH keys from cleanup. The cleanup operates within the context of the logged-in user, not root, ensuring user-specific data protection. After cleanup, the system verifies the amount of space reclaimed against the actual free volume.
Triggering this cleanup from an Edge DX alert, either automatically due to disk usage thresholds or on-demand, enables a small dashboard that reports on reclaimable and freed disk space, all without requiring elevated permissions, Intune writes, or admin consent. One of the more challenging technical aspects was delivering the cleanup dialog from a root-level agent into the user’s session, given the restrictions of macOS and Windows environments.
The community member shared that while the script could likely be optimized or shortened by more experienced developers, this version works reliably and safely. Detailed setup documentation is available by request. Additionally, to complement the cleanup tool, the developer created an analytics dashboard to track the cumulative space saved by the script. This solution offers a practical way for organizations using ControlUp Edge DX to empower their end users with safe, controlled disk cleanup capabilities, minimizing helpdesk workload without compromising disk security or user privacy.
For more on creating and managing custom alerts and actions within ControlUp Edge DX, consult the official documentation at https://docs.controlup.com/edge and explore ControlUp Academy at https://cuacademy.controlup.com for training on extending ControlUp functionality.
Read the entire article here...
Read the entire article here...
Automating VDI Registration in ControlUp Console
Automating the addition of Virtual Desktop Infrastructure (VDI) machines to the ControlUp console upon agent installation can streamline management and monitoring processes. While ControlUp for Desktops offers a command-line installation method that automatically registers machines, a similar approach for VDIs requires specific configuration.
To achieve automated registration of VDIs, you can utilize the Install-CUAgent PowerShell cmdlet, which is part of the ControlUp Automation module. This cmdlet allows for the download and installation of the ControlUp Agent on local machines, including VDIs. By providing the necessary authentication key during installation, the agent registers the machine with your ControlUp environment. For non-domain-joined machines, an API authentication token is required. ([support.controlup.com](https://support.controlup.com/docs/install-cuagent-install-an-agent?utm_source=openai))
For non-persistent VDIs, such as those created from a master image, it's essential to configure the agent to handle these scenarios appropriately. By setting the agent as a master image, it ensures that new VDIs created from this image will automatically register with the ControlUp console, preventing duplicate entries and maintaining an accurate device inventory. ([support.controlup.com](https://support.controlup.com/v1/docs/agent-outbound-communication?utm_source=openai))
Additionally, enabling folder synchronization with your VDI infrastructure can further streamline management. This feature ensures that VDIs are correctly registered and prevents stale machines from cluttering the interface. By integrating with your VDI environment, ControlUp can automatically detect and manage VDIs, enhancing the efficiency of your monitoring and management processes. ([support.controlup.com](https://support.controlup.com/docs/connecting-to-your-vdi-infrastructure?utm_source=openai))
By implementing these methods, you can automate the addition of VDIs to the ControlUp console, ensuring accurate device registration and efficient management of your virtual desktop environment.
Read the entire article here...
Read the entire article here...
Analyzing Windows Client Boot Time Delays: Using External Scripts to Generate Boot Performance Reports in ControlUp Environments
A community discussion sought an effective method to analyze Windows client boot times with detailed insights into the causes of any delays. The original inquiry focused on whether there was an existing script or dashboard capable of breaking down boot delays, as the environment faced issues with slow client startups. Such diagnostics would provide valuable information to address client performance problems.
In response, a community member shared a beta script designed as a boot analyzer, which generates an HTML report summarizing boot performance. This script creates an output that visually breaks down boot times, helping identify the components or processes causing delays. However, the script does not currently save boot information within the ControlUp platform because the ControlUp agent is not active during the Windows boot phase, preventing direct integration of boot data into ControlUp's indexes.
While the script is substantial and complex, it offers a practical starting point for environments needing detailed boot-time diagnostics. The contributor noted the lack of time to fully test writing the boot data to the ControlUp index but confirmed the HTML report format is functional and aesthetically clear. The shared approach highlights the current workaround for boot analysis within ControlUp environments: external data collection and report generation rather than native ControlUp indexing, due to agent limitations during system startup.
For users seeking to monitor boot performance in Windows clients using ControlUp, this solution involves running external scripts to analyze boot metrics and then reviewing detailed offline reports. Until ControlUp supports native boot-time data collection via its agent during the startup phase, such scripts provide the most direct method to diagnose and troubleshoot boot delays.
Read the entire article here...
Read the entire article here...
Comprehensive User-Created Training and Operating Manual for ControlUp Real-Time DX Console
A ControlUp community member has created a comprehensive Training and Operating Manual for the ControlUp Real-Time Digital Experience (DX) Console, originally developed as internal training material but now shared publicly to benefit the wider user community. The manual spans roughly 22 pages and includes detailed explanations, diagrams, and knowledge base references, aiming to deepen understanding of ControlUp’s architecture, setup, operations, and troubleshooting.
The manual covers multiple critical areas for both new and experienced users. It begins with an overview of the console architecture and the data collector pattern, supported by detailed diagrams to visualize the system’s workings. Installation topics include the sequence of setup steps, pitfalls like the “shared-credentials trap,” mechanisms for Multi-Site Association, and agent auto-deployment processes. For everyday operations, the manual highlights powerful console features such as column grouping, Branch Mapping, and registry comparison. It also clarifies common confusions around event logs, particularly the differences between LogName and event ID.
Troubleshooting guidance is a key focus, addressing connectivity challenges including those posed by corporate proxy environments, with practical PowerShell snippets included to assist in resolution. Advanced topics such as script actions with argument extraction from column values are also presented. The manual further differentiates ControlUp’s on-premises variants, specifically IOP, COP, and SOP configurations, which is valuable for users managing hybrid or fully on-premises deployments.
This document is an independent user-created resource and is explicitly noted as unofficial; it does not carry warranty, support, or official endorsement from ControlUp. Users are encouraged to use it as a supplement to official resources and to consult ControlUp’s Knowledge Base and ControlUp Academy for formal guidance. The author invites feedback and corrections from the community to improve the manual’s accuracy and usefulness over time. This shared resource represents a valuable starting point and practical reference for ControlUp console users wishing to deepen their operational knowledge and troubleshooting skills.
For official documentation and further training, users can visit the ControlUp Knowledge Base at https://docs.controlup.com and the ControlUp Academy at https://cuacademy.controlup.com.
Read the entire article here...
Read the entire article here...
How to Use ControlUp Live View to Identify Processes Causing CPU Spikes in VDI Environments
When attempting to diagnose CPU spikes and identify the specific processes responsible using ControlUp, the most effective approach is to utilize the Live view, also known as the VDI page in the ControlUp Web UI. This view provides real-time, granular insights into process-level CPU consumption across virtual desktop infrastructure (VDI) environments. Unlike historical reports, which show aggregated past data such as CPU Utilization Max but lack immediacy, the Live view updates metrics approximately every three seconds, enabling administrators to track CPU spikes as they happen and correlate them with individual processes.
Accessing this Live view requires either appropriate licensing or configuration that may prompt for a user principal name (UPN) login depending on how ControlUp is set up in the organization. When correctly logged in, administrators can drill down into specific machines experiencing CPU spikes and see a detailed, sortable list of CPU-intensive processes. This functionality helps pinpoint the exact processes causing resource bottlenecks, which is critical since the total CPU utilization of a machine does not always equal the sum of all visible processes. This discrepancy arises because kernel interrupts and other system-level operations that consume CPU are not attributed to individual user processes.
Users noted that if access to the Live view is initially unavailable or the relevant VDI tab not visible, it may be due to missing licenses or particular configuration settings controlled by the ControlUp administrator in the environment. In such cases, reaching out to the administrator and providing the UPN for authentication often resolves access issues. Without this, troubleshooting CPU spikes becomes difficult, and users may resort to external scripting solutions like PowerShell, which can be less reliable and less integrated.
Once logged into the Live view, operators can monitor real-time CPU usage per user and process, identify the top five consumers, and respond quickly to performance incidents causing a slowdown in the VDI environment. While the Live view is potent for immediate troubleshooting, storing long-term granular process data in a live manner is impractical due to data volume and cost, so ControlUp uses historical reports for trend analysis. Overall, the Live view is regarded as an essential and powerful feature in ControlUp’s suite for understanding and resolving CPU utilization spikes in virtualized desktop environments.
For further information on configuring and accessing the Live view in ControlUp, administrators can consult the official ControlUp documentation at https://docs.controlup.com and the ControlUp Academy at https://cuacademy.controlup.com. These resources cover licensing requirements, configuration steps, and best practices for effectively using real-time monitoring to maintain optimal VDI performance.
Read the entire article here...
Read the entire article here...
Utilizing Microsoft Teams API with ControlUp UCC dashboards
A user named Seb shared three ControlUp UCC dashboards that use Microsoft Teams API data only - no CU4D agent needed. The dashboards show real Teams call quality and usage before the agent reaches the endpoints. It includes graphs for daily, weekly, and monthly trends, as well as MOS bands and per-user statistics. These dashboards can be customized to specific needs. Other users showed appreciation for Seb's contribution.
Read the entire article here...
Read the entire article here...