
Learn how to connect AI to live enterprise data using the ControlUp MCP Server. In this session, Chris Twiest explains the fundamentals of Model Context Protocol (MCP), including LLMs, prompts, system prompts, tool calling, and retrieval, before demonstrating how to connect Claude Desktop to ControlUp. Watch a live walkthrough of configuring the MCP Server, querying real-time endpoint data, visualizing application crashes, comparing results against historical baselines, and using system prompts to dramatically improve AI accuracy. The session also explores practical use cases, including upgrade planning, combining multiple MCP servers, building custom AI interfaces, and the future of autonomous endpoint management.
Read the entire article here...
Microsoft Related Training & Support Archives
Microsoft training and support-related archives from inside the ControlUp Community on Slack.

Automating VDI Registration in ControlUp Console
Automating the addition of Virtual Desktop Infrastructure (VDI) machines to the ControlUp console upon agent installation can streamline management and monitoring processes. While ControlUp for Desktops offers a command-line installation method that automatically registers machines, a similar approach for VDIs requires specific configuration.
To achieve automated registration of VDIs, you can utilize the Install-CUAgent PowerShell cmdlet, which is part of the ControlUp Automation module. This cmdlet allows for the download and installation of the ControlUp Agent on local machines, including VDIs. By providing the necessary authentication key during installation, the agent registers the machine with your ControlUp environment. For non-domain-joined machines, an API authentication token is required. ([support.controlup.com](https://support.controlup.com/docs/install-cuagent-install-an-agent?utm_source=openai))
For non-persistent VDIs, such as those created from a master image, it's essential to configure the agent to handle these scenarios appropriately. By setting the agent as a master image, it ensures that new VDIs created from this image will automatically register with the ControlUp console, preventing duplicate entries and maintaining an accurate device inventory. ([support.controlup.com](https://support.controlup.com/v1/docs/agent-outbound-communication?utm_source=openai))
Additionally, enabling folder synchronization with your VDI infrastructure can further streamline management. This feature ensures that VDIs are correctly registered and prevents stale machines from cluttering the interface. By integrating with your VDI environment, ControlUp can automatically detect and manage VDIs, enhancing the efficiency of your monitoring and management processes. ([support.controlup.com](https://support.controlup.com/docs/connecting-to-your-vdi-infrastructure?utm_source=openai))
By implementing these methods, you can automate the addition of VDIs to the ControlUp console, ensuring accurate device registration and efficient management of your virtual desktop environment.
Read the entire article here...
Read the entire article here...
Managing Access to Microsoft Teams Meeting Recordings: Insights and Permissions
ControlUp does not currently offer direct insights into Microsoft Teams meeting recordings or their access logs. Meeting recordings in Teams are stored in the organizer's OneDrive or SharePoint, depending on the meeting type. For private meetings, recordings are saved to the organizer's OneDrive, while channel meetings store recordings in the SharePoint site associated with the channel. ([learn.microsoft.com](https://learn.microsoft.com/en-us/MicrosoftTeams/tmr-meeting-recording-change?utm_source=openai))
To monitor access to these recordings, organizations can utilize Microsoft Purview, which provides auditing capabilities for Teams content. Purview allows administrators to track activities related to meeting recordings, such as who accessed or shared the recordings. This functionality is particularly useful for compliance and security purposes. ([learn.microsoft.com](https://learn.microsoft.com/en-us/purview/edisc-search-teams?utm_source=openai))
Additionally, meeting organizers can manage access permissions for their recordings directly within Teams. By default, access is set to "Everyone," but organizers can customize this setting to restrict access to specific individuals or groups. This control ensures that only authorized users can view or download the recordings. ([support.microsoft.com](https://support.microsoft.com/en-us/teams/meetings/customize-who-can-access-a-recording-or-transcript-in-microsoft-teams?utm_source=openai))
In summary, while ControlUp does not provide direct insights into Teams meeting recordings, organizations can leverage Microsoft Purview for auditing access and utilize Teams' built-in features to manage recording permissions effectively.
Read the entire article here...
Read the entire article here...
How to Diagnose Microsoft Teams SlimCore Optimization in Citrix and Other VDI Environments Using PowerShell Scripts
This discussion highlights two PowerShell scripts developed to aid tracking and diagnosing Microsoft Teams SlimCore Optimization specifically within Citrix environments, with potential applicability to Azure Virtual Desktop (AVD), Windows 365 (W365), and VMware Horizon sessions. SlimCore is an optimized media stack used in virtual desktop infrastructure (VDI) scenarios to enhance Teams call performance by offloading audio and video processing to the client side.
Read the entire article here...
Read the entire article here...
How to Calculate and Display Compliance Percentage Using ControlUp JSON Query and Transformations
This discussion addresses how to display a compliance percentage in a ControlUp dashboard card based on two widget values: total devices and compliant devices. The goal is to calculate and show a compliance rate as a percentage, for example, showing 5% if 10 out of 200 devices are compliant. The solution involves using the ControlUp JSON builder with a custom query and transformation setup.
To achieve this, the key is to use the "CombineMetrics" plugin in the JSON configuration. This plugin allows the calculation of a ratio (a percentage) by specifying the compliant devices count as the numerator and the total devices count as the denominator. Participants shared examples modeled after an AI dashboard where a similar percentage metric—percentage of users accessing AI-related websites—is calculated by summing durations and using filters.
One example query includes the use of "cardinality" aggregation on device IDs, filtering by device groups and OS details to separately count total devices and compliant ones. This data is then fed into a transformation block that scales the ratio by 100 and applies precision to display the percentage nicely. The JSON snippet demonstrates how the numeratorNodeIds and denominatorNodeIds correspond to the compliant and total device counts, respectively, providing a ready-to-adapt template.
Additionally, the conversation touched on the potential for applying conditional palette colors to the percentage display, similar to gauges, to visually represent thresholds (e.g., red for 0%, orange at 50%, green at 100%). Though not yet implemented, this idea is being considered as part of ongoing UI improvements.
For further implementation guidance, ControlUp documentation on custom widgets and the JSON query builder is a useful resource at https://docs.controlup.com. The approach described can support not only two values but can be extended to combine multiple metrics as needed, providing flexible compliance and performance monitoring visualizations in ControlUp dashboards.
Read the entire article here...
Read the entire article here...
Monitoring CPU Thermal, Power, and Frequency Throttling with Custom ControlUp Scripts and Dashboards
A common challenge in monitoring CPU performance is that traditional CPU utilization metrics often fail to reveal the underlying causes of slowdowns, especially in cases related to thermal or power throttling that reduce CPU frequency without triggering high CPU%. To address this, a detailed custom PowerShell script and accompanying dashboard have been developed to report CPU temperature, frequency, and distinct throttling signals in a granular and actionable way. This solution creates a dedicated data index named `custom_cpu_throttle` to track multiple independent throttling signals, enabling more precise diagnostics of CPU performance issues.
The core innovation of this approach lies in splitting CPU throttling indicators into three separate categories: thermal throttling (hardware/BIOS-related issues such as overheating or dust), power throttling (policy-related causes like power plans, Intune profiles, or BIOS max-state configurations), and frequency throttling (cases where the CPU clock speed drops below 85% of the rated max under load, capturing otherwise silent throttling scenarios common on AMD processors or CPUs with boost frequencies). By differentiating these factors, the method captures scenarios where traditional Event ID 37 logs or CPU utilization metrics miss critical performance degradations.
The script captures a range of per-device metrics during each run, including temperature and its source, throttle status types, current and maximum CPU frequency with a ratio percentage, and comprehensive throttling evidence logs that correlate performance drops with frequency and utilization data. This data feeds into a customizable ControlUp dashboard that aggregates key performance indicators, categorizes throttle types, tracks frequency trends, and identifies devices exhibiting the hottest or most throttled behavior. The dashboard also correlates these metrics with user experience signals like application crashes and digital employee experience (DEX) scores, enabling targeted troubleshooting from a single pane of glass.
Technical details specify that the solution runs on Microsoft Windows devices using PowerShell scripts triggered every two minutes (120 seconds) with a 60-second timeout and sends data to the `custom_cpu_throttle` index only when devices are online. The solution supports filtering by device, throttle type, and status for focused analysis. While the script covers many AMD-specific throttling scenarios, some complexities remain given AMD's diverse behaviors, though unrealistic values are filtered out to maintain accuracy. This tool is well-suited for IT administrators and helpdesk teams looking to resolve performance tickets where CPU utilization appears normal but throttling impacts response times, such as in Outlook or other user-facing applications.
For detailed setup or a walkthrough, the script (`SP-CPU-Throttle-v2.ps1`) and ControlUp dashboard configuration (`SP-CPU-Throttle-Dashboard.json`) are available on request. This solution is an example of extending ControlUp’s monitoring capabilities via custom scripts and dashboards to deliver deeper insights into CPU performance issues that go beyond default instrumentation.
Read the entire article here...
Read the entire article here...
Widget Wednesday #24: Managing Dashboard Access with Roles and Tags
Widget Wednesday #24 explores new dashboard roles, tags, and sharing capabilities in ControlUp Dashboards, helping administrators organize dashboards and control user access more effectively.
Read the entire article here...
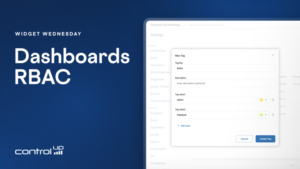
Read the entire article here...
Utilizing Microsoft Teams API with ControlUp UCC dashboards
A user named Seb shared three ControlUp UCC dashboards that use Microsoft Teams API data only - no CU4D agent needed. The dashboards show real Teams call quality and usage before the agent reaches the endpoints. It includes graphs for daily, weekly, and monthly trends, as well as MOS bands and per-user statistics. These dashboards can be customized to specific needs. Other users showed appreciation for Seb's contribution.
Read the entire article here...
Read the entire article here...
Clarifying Branch Mapping on ControlUp Support Site
A user asked about revising an article on branch mapping on the ControlUp support site. There was a discussion about clarified headers and columns for the CSV file. Final clarification was given that the subnets should be in the first column and the branch name in the second column.
Read the entire article here...
Read the entire article here...
ControlUp Community Meetup #14: Inside ControlUp DaaS IQ — A Deep Dive with PM Gilad Broun
AVD management doesn’t have to be hard and expensive.
If you run Azure Virtual Desktop, you know the pain: unpredictable costs, fragile PowerShell scripts, fragmented visibility, and tab-hopping between the Azure Portal, Intune, and a dozen custom tools just to keep the lights on.
ControlUp’s answer is DaaS IQ — a purpose-built control plane for AVD that replaces the chaos with smart, reusable policies, centralized lifecycle management, and real-time cost intelligence.…
Read the entire article here...

Read the entire article here...