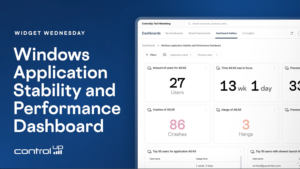
Widget Wednesday #22 explores the Windows Application Stability and Performance Dashboard, providing insights into application crashes, hangs, freezes, resource usage, launch performance, and version comparisons.
Read the entire article here...
Zoom Related Training & Support Archives
Zoom training and support-related archives from inside the ControlUp Community on Slack.
How to Pinpoint CPU-Heavy Processes Across Your VDI Fleet with ControlUp
This thread walks through a real customer question: how do you find which processes are eating the most CPU across a large VDI estate (200 servers) over a long period, so you know what to optimize?
It starts in ControlUp Dashboards. Using the VDI process data, you can build a widget showing top processes by CPU, then narrow it to the machines you care about using global filters (filter by folder, or switch to query filters with IS / IS NOT). A table beats a bar chart for a top-50 view, and any filters and time frames you set are saved in the URL, so you can bookmark or share the exact view. The built-in Gallery dashboards (notably "Big Screen Dashboard VDI") already include a processes-by-CPU widget out of the box.
The harder part is the one the customer really cared about: getting a meaningful picture across all machines rather than a single noisy spike on one box. The data is stored per process per 5-minute timeslot, not pre-aggregated per machine, so the practical approach that emerged was:
Filter to the folder containing all target machines.
Use CPU usage P95 to strip out short, expected spikes (with a fallback to average CPU, since P95 returned N/A in some environments — a possible bug worth a support ticket).
Add metrics under Advanced: computer_name (unique count) to see how many machines run the process, and process_name (count) to see how often it appeared (each record ≈ a 5-minute aggregate).
The processes worth optimizing are the ones combining high CPU + high machine count + high record count.
Worked example: a process showing ~1,080 records across 197 machines roughly translates to ~90 hours of activity over 7 days, or a few minutes per machine per day. The same method surfaced candidates like CompatTelRunner.exe, WerFault.exe, and WEM-related activity for further investigation. To go deeper, the App Trends and App Statistics reports let you drill into a specific app, and product_name data helps identify what's actually behind generic process names like setup.exe.
A few important caveats came up: averages hide spikes (10% average could be one minute at 100%), process counts are per machine, and hypervisor-level CPU (e.g., XenServer) can disagree with in-VM agent data when hosts are over-provisioned — which is also why a Sizing Recommendations report may suggest removing vCPUs even on a machine that looks maxed out.
Bottom line: use the dashboard to identify the heavy processes (folder filter + P95/avg CPU + machine count + record count), then use the App Trends report to dig into the details per app.
Read the entire article here...
Read the entire article here...
When AI Helps, When It Doesn’t: Notes From a Fireside Chat on IT’s Next Chapter
In our latest ControlUp Community Meetup, Co-Founder Yoni Avital, ControlUp expert Eugene Kalayev, and Shane Kleinert from Choice Solutions sat down for a fireside chat on where EUC is headed. The panel tackled the big question: where does AI actually fit in EUC operations?
Read the entire article here...

Read the entire article here...
How to Zoom in on CPU Utilization Graph in ControlUp’s Session Activity Report
A user inquired about zooming in on the CPU Utilization graph within the Reports -> Session Activity report for VDI. Another user shared that clicking and dragging on the graph will zoom in on the desired time period. This was found to be easier than expected.
Read the entire article here...
Read the entire article here...
Creating ServiceNow tickets with correct device name in workflow
The discussion about how to include the device name in a ServiceNow ticket created by a workflow includes a tip to add the device name to the New Incident description as a variable. There is also a Zoom call for further assistance and a request for an update once the alert fires again.
Read the entire article here...
Read the entire article here...
Troubleshooting Screen Recording in ControlUp for macOS with an MDM Deployment
A user posed a question regarding an MDM deployment of ControlUp for macOS and how the screen recording window should behave when remote access is attempted. Other users clarified that the pop-up is expected and not able to be managed by an MDM due to Apple restrictions. Additionally, it was noted that only standard users can approve screen recording via PPPC and other Quotes could be found. The article available is no longer available.
Read the entire article here...
Read the entire article here...
Introducing Global DEX Findings by ControlUp
Over the past several months, we’ve been using ControlUp’s global, anonymized telemetry to look for real patterns—crash surges, unstable binaries, regressions tied to specific builds, and behavior that only becomes obvious when you zoom out beyond a single environment. Not alerts. Not anecdotes. Actual signals that repeat across many customers.
Read the entire article here...

Read the entire article here...
Episode #19 – Conversation with Beau Dolinsky, VP of Customer Experience at ControlUp
Tune in to Episode #19 of ControlUp Community Radio, where host Douglas Brown interviews Beau Dolinsky, Vice President of Customer Experience at ControlUp. Beau shares insights from his impressive career, including roles at Citrix and Zoom, and discusses his passion for creating exceptional experiences.
Beau emphasizes the value of a “customer-obsessed” culture, detailing how addressing customer pain points and actively incorporating feedback can significantly reduce churn and enhance overall satisfaction.…
Read the entire article here...

Read the entire article here...
Using Synthetic Monitoring to Monitor External Services, URL Recommendations from ControlUp Members
Members discuss using synthetic monitoring to monitor external services such as Zoom, Telegram, Discord, and Slack. They mention the benefits of receiving alerts for service outages, and the need to determine reliable URLs for monitoring. Netify.ai's list of applications with their corresponding URLs is suggested as a starting point. There is also a mention of possibly bundling apps to streamline the process.
Read the entire article here...
Read the entire article here...
Understanding the Installed Apps Report on ControlUp’s DEX Portal
A user asked if the DEX portal's installed apps report gathers info on per user installs. Another user was unsure and asked for clarification from a member involved with report descriptions. The answer is that the report shows both per user and system-wide installs, and the user can use filters to sort through the data. Citrix Published apps are also included in the report.
Read the entire article here...
Read the entire article here...