A user asked about issues with CPU utilization data not showing in the App Trends report, to which Yoni responded that it is common for many processes to sit at 0% CPU and suggested checking the distribution for more insights. Another user inquired about checking successful vs failed sessions, to which another user requested clarification about what is meant by "failed sessions." The discussion included a screenshot and example of checking process distribution.
Read the entire ‘Troubleshooting CPU Utilization Data in ControlUp App Trends Report’ thread below:
Hi there, the CPU utilization doesn’t show any data, why? I got data for Memory, Network, RAM etc. This is under Reports > App Trends
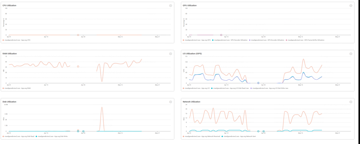
based on the screenshot, we do have CPU data, it just sits on 0% CPU..
this is quite common for the App Trends report, which show an average of all process instances in each relevant 5-min data point
usually most processes will sit on 0% CPU, and if you have a LOT of instances, you need many of them to cross 0% CPU to see higher usage
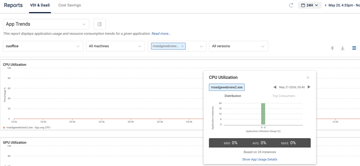
you should be able to click on each data point on this chart, and see a distribution that will tell the full story
like this:
Thanks Yoni, that helped a lot. Am I able to check successful sessions vs failed sessions in a smooth way?
hey @member, what exactly do you mean by "failed sessions"?
do you mean failed citrix connection attempts? or something else?
Continue reading and comment on the thread ‘Troubleshooting CPU Utilization Data in ControlUp App Trends Report’. Not a member? Join Here!
Categories: All Archives, ControlUp Dashboards