A user was unsure how to interpret the value 190% in a discussion with @member. @member recommended providing more hardware and CPU details for further investigation. It was later discovered that the issue was due to agent deployment with multiple devices reporting under the same ID, causing the CPU load event to be summed up incorrectly. The post serves as a helpful reference for others experiencing a similar issue.
Read the entire ‘Troubleshooting High CPU Utilization on ControlUp.’ thread below:
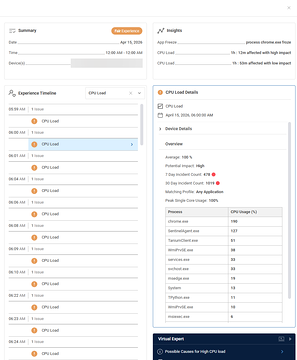
190%. Not sure how to interpret this.
@member
Hey Arthur, can you provide details about the hardware/CPU cores etc as well. Henri can have a look in the morning
I took this to emails so I could share identifying information. But for those reading along or stumbling into this via search or something.
This is due to a problem with agent deployment. Multiple devices are reporting under the same ID.
Employees queries an index based on the timestamp of the CPU load event and the device ID. It then groups by process name and sums the CPU utilization.
In this case, it was summing up 10 machines worth of Chrome processes for that 1 minute timestamp.
15 + 29 + 6 + 13 + 43 + 29 + 7 + 11 + 27 + 10 = 190
nice catch
Continue reading and comment on the thread ‘Troubleshooting High CPU Utilization on ControlUp.’. Not a member? Join Here!
Categories: All Archives, ControlUp for Desktops