
A user has a question about displaying online and offline devices using the 'last_communication' property with a range filter. Members suggest using a range filter on any other metric or playing around with the advanced editor to modify the JSON. They also suggest looking at more advanced features and plans for the future. The possibility of linking one table to two indexes is discussed, but is not currently supported. A different solution is being looked into for the future.
Read the entire article here...
ControlUp Dashboards
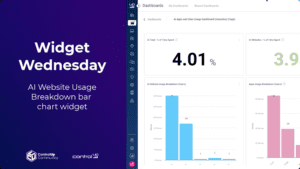
Widget Wednesday #2: Tracking AI Website Usage Across Your Environment
In this episode of Widget Wednesday, we take on a topic that’s top of mind for many IT teams right now: AI usage visibility.
Read the entire article here...
Read the entire article here...
Changing Default Date Setting in ControlUp
A user inquired about the possibility to change the default setting of 7 days to today on ControlUp. The answer is that it is not possible at the moment, but the platform does support URL parameters for dashboard bookmarks, which can be set to range=0d for today's date.
Read the entire article here...
Read the entire article here...
Creating Endpoint Alerts with ControlUp
Some users discussed creating endpoint alerts using ControlUp and shared resources for ideas. There was also mention of event monitoring and a planned upgrade to version 9.1.5. One user created a Google doc with alert ideas to share with others.
Read the entire article here...
Read the entire article here...
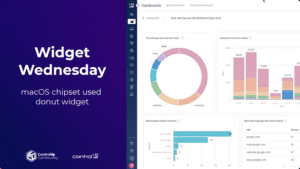
Widget Wednesday #1: Visualizing macOS Device Inventory with Donut Graphs
In this first episode of Widget Wednesday, we kick off a new video series focused on practical, real-world dashboard widgets you can build directly inside ControlUp.
Read the entire article here...
Read the entire article here...
Troubleshooting Dashboard Access on ControlUp
A user is having trouble accessing dashboards on ControlUp and asks for help. Another user responds that the dashboards are still in beta and may require specific prerequisites, such as enabled end user activity tracking. The first user confirms they have a desktops license and suggests it may not be working due to a renewal issue. They express hope that the feature will be extended to VDI and have submitted feature requests for report formatting. Another user responds that ControlUp is working on enabling VDI and more. The first user mentions having a case open for the license issue.
Read the entire article here...
Read the entire article here...
Building Dashboards for Organization WiFi Information
There was a discussion about creating a dashboard for organization WiFi information. The dashboard includes an OS breakdown, devices connected to the SSID, devices with the lowest WiFi signal, and now they also want to show latency and devices with the highest latency. One user shared their dashboard and another user said they loved it and made a copy to change the filters for their organization's SSID. The first user said they would add some of their own data to the other user's dashboard. However, the first user's dashboard didn't save after some changes were made.
Read the entire article here...
Read the entire article here...
New Feature Request: Exclude Latest Version from Dashboard Version Statistics on ControlUp
A user suggested a new feature to exclude the latest version of an application when looking at version statistics on the dashboard, in order to have a more accurate view of older versions and their progress after remediation. This feature would require some backend query language updates and would be considered for implementation based on its priority.
Read the entire article here...
Read the entire article here...
Troubleshooting the Microsoft Copilot+ Readiness Dashboard in ControlUp
The team discussed the availability of the ai_report index in the Microsoft Copilot+ Readiness Dashboard. It was determined that a custom script is needed to populate the index and it can be found under device events. Support may need to be contacted if the script does not run automatically. A new automation and scripting dashboard has been added for more details on script runs.
Read the entire article here...
Read the entire article here...
Troubleshooting the SECOCL64.exe Crash in ControlUp.
The conversation on the company ControlUp discusses a crash occurring with the SECOCL64.exe application. Possible causes mentioned include a bug in the application binary, incompatible DLL injection, or a corrupt installation. It is suggested to check the event viewer, verify the installed version, and look for conflicting software. Other solutions suggested include reinstalling or repairing the application and checking for Windows updates. A custom dashboard will soon be released to make it easier to track crashes in an organization. It is also recommended to update audio drivers and disable DLL injections. Registries to enable crash dumps for SECOCL64 are provided for root cause proof.
Read the entire article here...
Read the entire article here...