Widget Wednesday #13 highlights ControlUp dashboard updates, including automated Microsoft Copilot readiness insights, improved crash visibility, and a new Windows Boot Certificate Migration dashboard with remediation capabilities.
Read the entire article here...
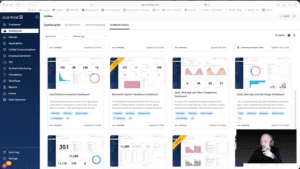
ControlUp Dashboard How To Videos - Widget Wednesday
Widget Wednesday is a hands-on video series focused on building DEX, EUC, practical, real-world widgets inside ControlUp dashboards, walking through how widgets are designed, configured, and refined to turn raw telemetry into clear, usable insights. Each episode is short and actionable, highlighting patterns and techniques you can apply directly to your own dashboards to better visualize, group, and understand your data.
Widget Wednesday #12: Introducing Grid Viewer for Raw Data Exploration
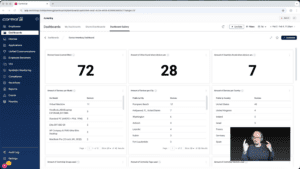
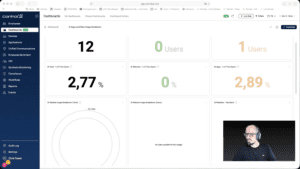
This week’s Widget Wednesday introduces a powerful new widget type in ControlUp Dashboards, the Grid Viewer.
Unlike traditional widgets that summarize data through averages, totals, or grouped metrics, the Grid Viewer gives you direct access to raw data. It’s designed for situations where you want to see exactly what’s happening under the hood and shape the view around your specific needs.…
Read the entire article here...
Read the entire article here...
Widget Wednesday #11: Smarter Dashboard Filters, Faster Answers
Widget Wednesday #11 introduces enhanced dashboard filters in ControlUp Dashboards, including improved search, AND/OR logic, and shareable filter-based URLs to streamline device analysis and collaboration.
Read the entire article here...
Read the entire article here...
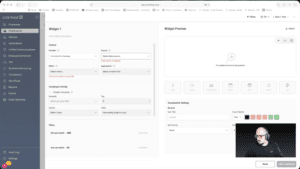
Widget Wednesday #10: Going Beyond Standard Widgets with the Expert Builder
In this episode of Widget Wednesday, we take a closer look at the Scripting and Automation Dashboard, focusing on the Script Execution Summary widget and how it's built.
Read the entire article here...
Read the entire article here...
Widget Wednesday #9: Getting Started with ControlUp Dashboards
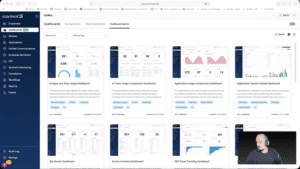
In this episode of Widget Wednesday, Chris Twiest walks through how to get up and running with ControlUp Dashboards—especially if you’re new, short on time, or not sure where to begin. The session is intentionally practical, with no assumptions or pressure, and focuses on the quickest path to building something useful.
Where to start
The episode opens with the basics of approaching dashboards for the first time.…
Read the entire article here...
Read the entire article here...
Widget Wednesday #8: Comparing Application Usage the Right Way
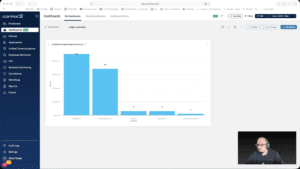
In this episode of Widget Wednesday, Chris Twiest walks through the Application Usage Comparison Dashboard from the Dashboard Gallery, focusing on how the full dashboard works together to turn raw usage data into meaningful, actionable comparisons inside ControlUp.
Read the entire article here...
Read the entire article here...
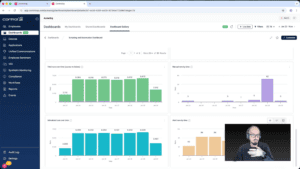
Widget Wednesday #7: Using DEX Score Trending to Spot Problems Before Users Feel Them
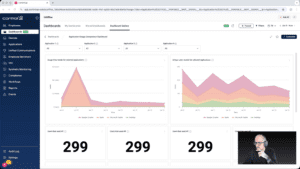
In this episode of Widget Wednesday, Chris Twiest walks through the DEX Score Trending Dashboard and shows how it helps surface device performance issues before they turn into widespread employee experience problems inside ControlUp.
Read the entire article here...
Read the entire article here...
Widget Wednesday #6: Analyzing AI Website Usage with ControlUp Dashboards
In this episode of Widget Wednesday, Chris Twiest walks through how to analyze AI website usage using ControlUp Dashboards, showing how to turn end-user activity data into clear, actionable insights across your environment.
Read the entire article here...
Read the entire article here...
Widget Wednesday #5: Troubleshooting “No Data Available” in Dashboards
In this episode of Widget Wednesday, Chris Twiest tackles a question almost every dashboard builder encounters at some point: why does a widget show “no data available”? The session focuses on practical troubleshooting techniques to help identify the root cause quickly and restore meaningful data in ControlUp dashboards.
Read the entire article here...
Read the entire article here...
Widget Wednesday #4: Using Curated Metrics for Clearer Dashboard Insights
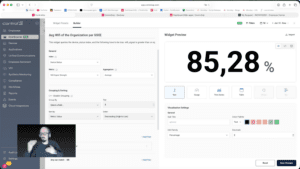
In this episode of Widget Wednesday, Chris Twiest explores how curated metrics simplify dashboarding and improve data quality, using the Average Wi-Fi Signal Strength Over Time widget as a practical example inside ControlUp dashboards.
Read the entire article here...

Read the entire article here...