
A discussion took place in ControlUp about building a dashboard for monitoring WiFi network experience based on SSID in four different campuses using the same name but different IP ranges. The suggestion of filtering by subnet on the new 2.18 version was brought up, but it was also recommended to group by BSSID for a better understanding of performance. The use of wildcards in filters and the potential of converting subnets from octets to numbers were also mentioned. @member and @member offered assistance with @member alerting the group of his involvement in creating a Wifi Dashboard but using BSSID instead of IP addresses. A demo tool for testing the desired dashboard was also provided by @member.
Read the entire ‘Creating a Campus-Specific Wifi Dashboard with ControlUp’ thread below:
Hello All,
Hope everyone is doing well.
I’d like to ask for some guidance regarding a dashboard I’m building for WiFi network experience monitoring based on SSID.
The challenge I’m facing is that we have 4 campuses using the same WiFi SSID name (for example: “Eugene WiFi”), however each campus operates on a different IP range.
Example:
• Campus 1 = 10.1.x.x
• Campus 2 = 10.2.x.x
• Campus 3 = 10.3.x.x
• Campus 4 = 10.4.x.x
I’m trying to determine the best approach to accurately separate and report on the experience per campus while still using the same SSID.
Any recommendations or guidance would be greatly appreciated. @member
I know that @member has also been experimenting with this at some point
so I would put a filter on ssid name on eufene wifi then group by ip and then add a OR filter on each IP range that should deliver what you want
Wouldn’t bssid grouping be better for this?
That would identify the unique access points
yeah maybe if that data is beter and would show campus 1,2,3,4 better then yes but I guess they will have more then 1 access point per campus
Yeah, it will require maybe some additional work, e.g. 4 "wifi tags" based on bssid and possibly some help from workflows, but I think it will create an overall better picture of per location performance etc
Eugene, do any of the location have multiple floors?
With bssid you could even get better understanding of performance in a mesh, e.g. when users roam within the location
Really depends on where you suspect certain issues occur
we have over 800 BSSID
and i was also thkining of the tagging but im at Campus 1 today , this weekend im flying to campus 2 and having a bad network exp , then it going to show that im having a bad campus 1 exp based on the tagging
yes all our buildings have 2 – 4 flours
With the amount of devices we have , im getting rate limit issues on workflows
Let’s see what Trentent says when he’s awake, will be a few hours. I know he was working on some wifi dashboard at some point, and curious to learn what happened to that and if there’s some recommendations he can provide
Thanks Guys
> With the amount of devices we have , im getting rate limit issues on workflows
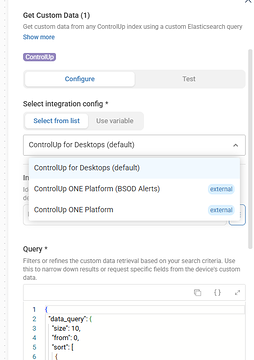
Even with the default integration? That one is new and doesn’t use the external, rate limited, API. But instead an internal API. Which technically has a limit. But I’d be surprised if you hit that one.
Also if you’re creating this dashboard on device status or netcfg. 2.18 adds subnet to a handful of indexes.
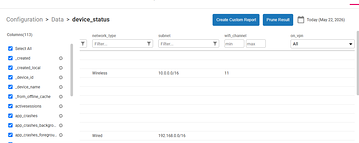
I assume you could group on that?
2.18 is not released yet #insidenews 😄
but that could work
Would need to see how it looks in our tenant
There are 2.18 versions/builds available that we are sharing with customers. If you’re open to beta versions, I’m sure someone can get you access
Lets wait for @member to have his 2nd cup of Coffee and see what he replies
Im already busy testing another agent , do not want too many agents in the fleet
Hi @member I’m testing out a new internal tool. What is the goal of the widget you would want to build in just one sentence if possible. Just want to test my internal tool if that’s ok?
Hey Chris I’ll try to put it in one sentence, but my goal is that I want a dashboard for each campus as we have IT site managers and each campus that will look at the dashboard and do not want all the data ow widgets in one . My next post will be the one sentence
WiFi network exp view of all the devices that are connected to the SSID EugeneWifi but the network interface or the IP of the device contains 10.1.*
Thanks man for sharing !!
Morning All
Any news from Trentent ?
Hi Eugene, I did create a Wifi Dashboard for us but it used BSSID as those are the physical antenna’s on the device. Going by IP Address is more difficult because IP’s are logically defined and could be assigned to a wrong AP or not assigned to one that is supposed to have it — giving you misleading information should that scenario occur.
The challenge with capturing subnet’s is that we don’t store it as a series of octets.
If you want to capture and group data by IP range, with how we show and present data today, you’ll need to convert the subnet/ip address from octets to a number. From there you could get the range of the IP to number and search within. For your example:
10.1.0.0 – 10.1.255.255 == 167837696-167903231
10.2.0.0 – 10.2.255.255 == 167903232-167968767
Unfortunately, I don’t think we do that out of the box so it would have to be a calculation run separately and referred to after somehow @member @member (maybe this is a feature request to natively support octets?)
However, we do have wild cards in our filters which should provide a similar result (eg, 10.1.* — I think this is what Chris suggested?)
@member’s suggestion of filtering on subnet on the new 2.18 might just provide a bit of native functionality out of the box, but I believe the subnet is still stored as a string so you need to do matching as if it’s a wildcard string search (still much better though!)
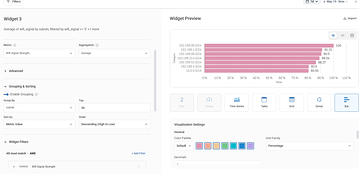
is what I was referring to
Continue reading and comment on the thread ‘Creating a Campus-Specific Wifi Dashboard with ControlUp’. Not a member? Join Here!
Categories: All Archives, ControlUp Dashboards, ControlUp Scripts & Triggers, ControlUp Workflows