
Users managing macOS devices within ControlUp reported an issue where script execution events only displayed "script started" and "script completed" messages without showing which script was run or its output. This behavior was a departure from prior functionality, where script details and outputs were visible. Windows devices did not exhibit this problem, and macOS scripts continued to generate output as expected. The concern arose when verifying the actual execution of scripts on macOS devices became necessary, but the ControlUp console failed to surface detailed script information.
Further investigation revealed that ControlUp versions 2.17 and 2.18 for macOS, as well as the Windows version, should include script details in raw event data accessible either through developer browser tools or the ControlUp API endpoint at https://api.controlup.io/reference/get-system-events. However, in the normal device view within ControlUp, the description field showing script details was missing or blank, even though the event index properly contained the script output information. This suggested a user interface issue rather than a complete loss of the event data.
The root cause appeared to be tied to the macOS 2.18 release state. The 2.18 build available was a special release candidate (RC) version, not yet generally available (GA), and it contained fixes targeting this exact problem. Users running this 2.18 RC version (including builds like 2.18.301.5B9E7EB35 and RC9) reported that the issue was resolved in those builds, with script details properly displayed alongside event logs. ControlUp staff offered to enable this release candidate on affected tenants to restore full visibility of macOS script execution events.
In summary, the lack of script detail visibility on macOS devices in ControlUp event views was a recognized bug in releases prior to 2.18. The problem was fixed in the 2.18 RC macOS agent builds, which restored proper logging and display of script names and outputs. Users encountering this should verify their macOS agent version and upgrade to the 2.18 RC or later when it becomes generally available. Meanwhile, script event data can still be queried directly via the ControlUp API or found in event indices, offering a workaround until the UI fully reflects the script details. For more information on monitoring system events and interacting with the ControlUp API, consult the official documentation at https://docs.controlup.com/ and https://api.controlup.io/reference/get-system-events.
Read the entire article here...
Browsers Related Training & Support Archives
Browsers training and support-related archives from inside the ControlUp Community on Slack.
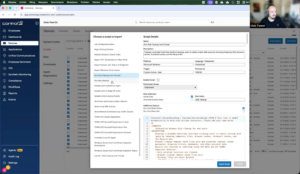
NEW ControlUp Disk cleanup script that actually asks the user what to delete
Chris Twiest demos a new interactive disk cleanup utility built by Sebastien Perusat and now baked into the product. Instead of silently cleaning from the system context, it prompts the end user with what can be reclaimed and lets them choose — recycle bin, temp files, browser cache. Works on Windows and macOS, can be triggered manually or from an alert, writes results to a data index and a device event, and is fully editable. Available in the script library now.
Read the entire article here...
Read the entire article here...
Troubleshooting “Detect Workspace” Stuck Prompt for Citrix Cloud Synthetic Monitors on Public Hives
Some users running synthetic monitors to test Citrix Cloud connections from public hives reported that a few monitors become stuck at the "Detect Workspace" prompt. This behavior was inconsistent, with some monitors seemingly configured the same way functioning normally while others encountered this issue.
The root cause was identified as related to the Citrix Workspace store’s launch method settings. The "Detect Workspace" screen corresponds to the Citrix client detection page, which is controlled on the store side rather than by Scoutbees or the synthetic monitors themselves. Specifically, when the store is configured with the "Launch virtual apps and desktops" setting set to either "Open in Citrix Workspace app" or "Let the user choose," this page appears. On public hives, where the browser environment is fresh and does not retain prior user choices, the prompt recurs on every run, causing the monitors to stall at this screen.
To resolve this, it is necessary to verify and compare the launch settings in Citrix Cloud under Workspace Configuration (or the targeted StoreFront store). Monitors stuck on the detection prompt typically point to stores configured with "Open in CWA" or "Let the user choose," while those that bypass the prompt are connected to stores set to "Use web browser to access apps and desktops." Changing the store’s launch setting to "Use web browser" bypasses the native Citrix Workspace app detection page, allowing the synthetic monitors on public hives to proceed without interruption.
Before making any changes, administrators should confirm these settings by comparing the store configurations between monitors that are stuck and those that are working. This ensures an accurate diagnosis and prevents unintended side effects from changing the launch mode. Since this is a store-level configuration, it requires adjustments within the Citrix Cloud management console, specifically under Workspace Configuration. If the issue persists or if the public hive environments themselves seem problematic, submitting a support ticket for those specific hives is recommended.
For additional guidance on managing Citrix Cloud Workspace configurations and optimizing monitor setups, see the ControlUp Knowledge Base and Citrix documentation on Workspace Configuration: https://docs.controlup.com and https://docs.citrix.com/en-us/citrix-cloud/workspace-configuration.html.
Read the entire article here...
Read the entire article here...
How to Enable File Browsing in ControlUp’s File Browser by Configuring Role Permissions
A common issue encountered with ControlUp's File Browser feature is the inability to see any files within a user's system during a remote session, despite being able to navigate folders. This typically occurs when the appropriate permissions are not enabled for the user role in ControlUp. For example, a user attempting to retrieve log files without interrupting a session might notice that the file list remains empty, even though directories are visible.
The root cause is often related to role permissions. By default, the built-in Admin role in ControlUp does not have the File Browser permission enabled for viewing files. To resolve this, administrators need to create a custom role that explicitly grants this permission. Specifically, under Device Permissions, navigating to Remote Management > Management > File Browser, the administrator must set the scope to allow users assigned this role to view files.
Once the custom role is created with the correct File Browser permissions, it is possible to assign the user both the built-in Admin role and this new custom role simultaneously. ControlUp's role-based access control supports multiple role assignments per user, enabling flexible and granular permission management without removing any existing higher-level roles such as Admin.
In summary, to access files via ControlUp’s File Browser, ensure that the user has a custom role with the "View Files" permission under File Browser enabled. This role can be combined with the default Admin role, allowing complete management capabilities while enabling file browsing. For detailed role creation and permission configuration instructions, refer to ControlUp's official documentation on role management at https://docs.controlup.com.
Read the entire article here...
Read the entire article here...
Troubleshooting a Workflow Scheduling Issue in ControlUp.
Some users reported a workflow issue where a scheduled workflow still appeared as manual, even after changing it to scheduled. Another user suggested that selecting an interval and offset time may solve this issue. The post includes screenshots showcasing the problem and solution, and a user confirms that the issue has been resolved. The team has been alerted to this issue.
Read the entire article here...
Read the entire article here...
How to Pinpoint CPU-Heavy Processes Across Your VDI Fleet with ControlUp
This thread walks through a real customer question: how do you find which processes are eating the most CPU across a large VDI estate (200 servers) over a long period, so you know what to optimize?
It starts in ControlUp Dashboards. Using the VDI process data, you can build a widget showing top processes by CPU, then narrow it to the machines you care about using global filters (filter by folder, or switch to query filters with IS / IS NOT). A table beats a bar chart for a top-50 view, and any filters and time frames you set are saved in the URL, so you can bookmark or share the exact view. The built-in Gallery dashboards (notably "Big Screen Dashboard VDI") already include a processes-by-CPU widget out of the box.
The harder part is the one the customer really cared about: getting a meaningful picture across all machines rather than a single noisy spike on one box. The data is stored per process per 5-minute timeslot, not pre-aggregated per machine, so the practical approach that emerged was:
Filter to the folder containing all target machines.
Use CPU usage P95 to strip out short, expected spikes (with a fallback to average CPU, since P95 returned N/A in some environments — a possible bug worth a support ticket).
Add metrics under Advanced: computer_name (unique count) to see how many machines run the process, and process_name (count) to see how often it appeared (each record ≈ a 5-minute aggregate).
The processes worth optimizing are the ones combining high CPU + high machine count + high record count.
Worked example: a process showing ~1,080 records across 197 machines roughly translates to ~90 hours of activity over 7 days, or a few minutes per machine per day. The same method surfaced candidates like CompatTelRunner.exe, WerFault.exe, and WEM-related activity for further investigation. To go deeper, the App Trends and App Statistics reports let you drill into a specific app, and product_name data helps identify what's actually behind generic process names like setup.exe.
A few important caveats came up: averages hide spikes (10% average could be one minute at 100%), process counts are per machine, and hypervisor-level CPU (e.g., XenServer) can disagree with in-VM agent data when hosts are over-provisioned — which is also why a Sizing Recommendations report may suggest removing vCPUs even on a machine that looks maxed out.
Bottom line: use the dashboard to identify the heavy processes (folder filter + P95/avg CPU + machine count + record count), then use the App Trends report to dig into the details per app.
Read the entire article here...
Read the entire article here...
Certificates for Teams integration on ControlUp Academy Updated
A user reported an issue with adding the Teams integration in workflows for testing. The ControlUp team acknowledged it as a devops issue and provided an update that the certificate has been updated. The user is advised to try their integration again.
Read the entire article here...
Read the entire article here...
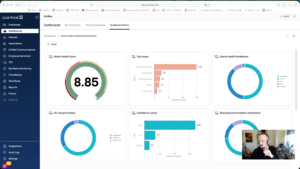
Widget Wednesday #18: New Filter UI and Unified Filtering Experience
Widget Wednesday #18 introduces a redesigned filter UI in ControlUp Dashboards with expanded filtering options, unified variables and filters, and improved usability for faster, more flexible data analysis.
Read the entire article here...
Read the entire article here...
Troubleshooting High CPU Utilization on ControlUp.
A user was unsure how to interpret the value 190% in a discussion with @member. @member recommended providing more hardware and CPU details for further investigation. It was later discovered that the issue was due to agent deployment with multiple devices reporting under the same ID, causing the CPU load event to be summed up incorrectly. The post serves as a helpful reference for others experiencing a similar issue.
Read the entire article here...
Read the entire article here...
Controlling Access to VDI Metrics with ControlUp Custom and Upcoming Dashboards
In a discussion about sharing VDI metrics with SLT without revealing unnecessary information, Custom Dashboards with restricted access and a possible upcoming Dashboards feature are mentioned. It is also suggested to export dashboards and send them periodically, but formatting issues may be a concern. The upcoming release for Dashboards for VDI is expected at the end of the month.
Read the entire article here...
Read the entire article here...