A discussion was held about troubleshooting missing CVAD metrics in Solve. It was mentioned that not enough capacity in the cluster could be the cause and monitoring via historical reporting or the Powershell option can help identify this issue. v9 will also have this data available in Solve.
Read the entire ‘Troubleshooting Missing CVAD Metrics in Solve for EUC Environments’ thread below:
Sanity check…
I have a EUC Environment connected via a DataCollector which is working nicely in RTDX (On-Prem).
BUT, when I check Solve, all the CVAD metrics are not available.
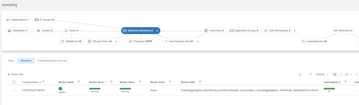
Checking the monitors (data sources in monitoring status) I see that the CVAD site is not listed on both monitor machines. (which explains why I cannot see something in solve)
"Exclude from ControlUp Monitors" is not touched so it states "inherited".
I have six NetScalers configured with the very same DataCollector which are working nicely.
Because I can connect the EUC Env via RTDX I dont assume some port misconfiguration…
The monitors are able to reach the DataCollector via port 40705.
Restarting ControlUp Monitors fixed it…
good to hear…
Keep an eye on it though. Typically resources like EUC environments, hypervisors, cloud connections, etc not being assigned is an indicator that the cluster doesn’t have enough capacity.
On-prem has the capacity reports in historical reporting that you can enable. I believe we enable them by default for most if not all customers.
There’s also the Powershell option. I think @member posted a script in the community. If not, I can post my version.
Last but not least, v9 will make this data available in Solve. For those that don’t have the on-prem option to enable the capacity reports. There are a few things to be ironed out for the Solve view of this data. So it might not be available directly at release.
here ya go, not an sba I believe there also might be a sba indeed
Run this on the COP server to enable the monitor reports in Insights.
Just figured out that the API-connections tend to disappear from data source in Monitor on a unregular basis.
So I will definetly enable the stuff mentioned.
Will try in lab then at customer.
Thanks
@member thanks for the script. What are adequate figures when running the script? Especially how did I interpret "Total Capacity", "Total Used Capacity" and "Total Used Capacity %"? Guess when the latter shows 100 I am screwed!? 🙂
@member thanks for the PowerShell. I ran it on COP with -IOPServer parameter. Unfortunately my IOP trials expired so I have to fix this first… 🙂
Where can I see the stuff I enabled with your script in IOP? I assume somewhere in "Monitor Details" report?
Thats the one!
It should look something like this. Cluster State will look a little different but this is the type of data you get. You want to make sure your capacity is good.
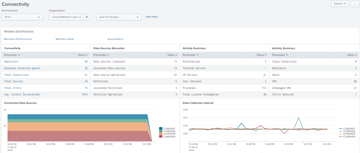

Also note that on the first screenshot, the 2nd table named data source allocation. It shows that Landon has 12 data sources and all 12 are assigned.
In your case you’ll probably see a mismatch between those 2.
A small mismatch is okay. Especially in larger clusters. As there is always some movement in data sources. But generally these should be very close to each other.
My own acceptable margin is 1% for automated health checks. So if you have 5000 data sources and you have 4950 assigned, that is just about acceptable though 50 missing data sources is still a lot.
Continue reading and comment on the thread ‘Troubleshooting Missing CVAD Metrics in Solve for EUC Environments’. Not a member? Join Here!
Categories: All Archives, ControlUp for VDI, ControlUp Scripts & Triggers