A user named Seb shared three ControlUp UCC dashboards that use Microsoft Teams API data only – no CU4D agent needed. The dashboards show real Teams call quality and usage before the agent reaches the endpoints. It includes graphs for daily, weekly, and monthly trends, as well as MOS bands and per-user statistics. These dashboards can be customized to specific needs. Other users showed appreciation for Seb’s contribution.
Read the entire ‘Utilizing Microsoft Teams API with ControlUp UCC dashboards’ thread below:
Moin all,
Sharing is caring, so these are going out to the community.
I built three ControlUp UCC dashboards that run on Microsoft Teams API (Graph) data only. No CU4D agent needed.
The point: real Teams call quality and usage before the agent is anywhere near the endpoints. Pilots, contractor and unmanaged devices, anything still stuck behind works-council approval. MOS, jitter and packet loss come straight from the Teams call records, so you get real numbers on day one.
Fair warning so nobody is surprised: Graph keys to the user and the meeting organizer, not the device. Per-device and per-room-system still needs the agent. Everything user and call centric works fine.
The three:
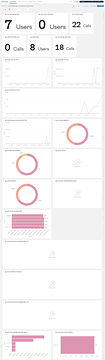
• Usage Over Time: calls, duration, participants, top users and locations, daily, weekly and monthly trends, plus setup and mid-call failures.
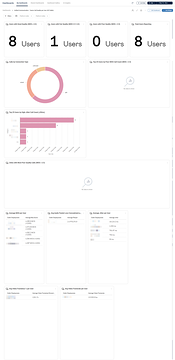
• Call Quality per User: MOS bands, worst users by poor MOS and high jitter, and per-user MOS, jitter, packet loss and video.
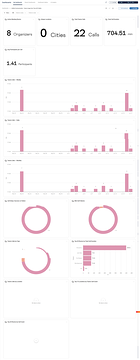
• Call Quality and Issues: quality over time, worst users, and the environmental stuff behind bad calls (weak WiFi, WiFi band, connection type).
All three import as JSON and ship with a time picker and platform filters.
Lieben Gruß
Séb
P.S.: not every environmnent has all the data so you might want to trim the Dashboards to match your needs!
LOVE IT! Thanks for sharing, Seb.
Nice!
Continue reading and comment on the thread ‘Utilizing Microsoft Teams API with ControlUp UCC dashboards’. Not a member? Join Here!
Categories: All Archives, ControlUp Dashboards