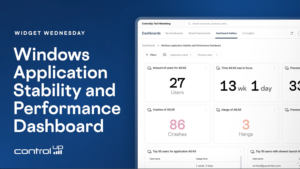
Widget Wednesday #22 explores the Windows Application Stability and Performance Dashboard, providing insights into application crashes, hangs, freezes, resource usage, launch performance, and version comparisons.
Read the entire article here...
CPU Related Training & Support Archives
CPU training and support-related archives from inside the ControlUp Community on Slack.
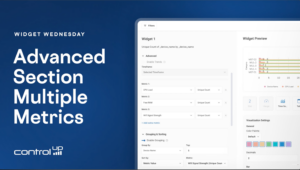
Widget Wednesday #21: Working with Multiple Metrics in Dashboards
Widget Wednesday #21 explores multi-metric support in ControlUp Dashboards, including aggregated tables, sorting, time series visualizations, and support for VDI and DAS IQ data.
Read the entire article here...
Read the entire article here...
Troubleshooting CPU Utilization Data in ControlUp App Trends Report
A user asked about issues with CPU utilization data not showing in the App Trends report, to which Yoni responded that it is common for many processes to sit at 0% CPU and suggested checking the distribution for more insights. Another user inquired about checking successful vs failed sessions, to which another user requested clarification about what is meant by "failed sessions." The discussion included a screenshot and example of checking process distribution.
Read the entire article here...
Read the entire article here...
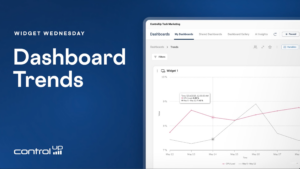
Widget Wednesday #20: Adding Trends to Dashboard Widgets
Widget Wednesday #20 introduces dashboard trends in ControlUp, enabling widgets to compare current metrics against previous periods across gauges, stat widgets, and time series visualizations.
Read the entire article here...
Read the entire article here...
How to View Device and Experience Scores in ControlUp Dashboard
Some employees were discussing the combination of Device Score and Experience Score in a consolidated view or score. @member asked if there was any built-in reports or dashboards to view this combination, and @member answered that it exists within the DEX Score Trending Dashboard from the Dashboard Gallery. However, there was some confusion as to whether this data is based on the Device Score or the Experience Score. It was clarified that the metric used is the Experience Score, and the breakdown of this score can be found in the Employee module. The team discussed different ways to view and analyze this information, and it was suggested that a call be set up for a deeper dive into the dashboards. The conversation also referenced ControlUp URLs such as https://support.controlup.com/docs/device-score and https://support.controlup.com/docs/experience-scores.
Read the entire article here...
Read the entire article here...
Troubleshooting Partial Data in ControlUp after Agent Replacement on AVD Session Host
A member reported that after replacing the agent on the AVD Session Host, they were only receiving partial data. They were still getting data on "Logon Duration" but not on CPU utilization. After troubleshooting, it was determined that the monitor server was causing the issue, but it has since been resolved.
Read the entire article here...
Read the entire article here...
When AI Helps, When It Doesn’t: Notes From a Fireside Chat on IT’s Next Chapter
In our latest ControlUp Community Meetup, Co-Founder Yoni Avital, ControlUp expert Eugene Kalayev, and Shane Kleinert from Choice Solutions sat down for a fireside chat on where EUC is headed. The panel tackled the big question: where does AI actually fit in EUC operations?
Read the entire article here...

Read the entire article here...
Troubleshooting High CPU Utilization on ControlUp.
A user was unsure how to interpret the value 190% in a discussion with @member. @member recommended providing more hardware and CPU details for further investigation. It was later discovered that the issue was due to agent deployment with multiple devices reporting under the same ID, causing the CPU load event to be summed up incorrectly. The post serves as a helpful reference for others experiencing a similar issue.
Read the entire article here...
Read the entire article here...
Widget Wednesday #15: Advanced Dashboard Filters — Simpler, Smarter, Global
Widget Wednesday #15 introduces advanced global filtering in ControlUp Dashboards, enabling more precise, real-time filtering across devices, attributes, and conditions without complex variable setup.
Read the entire article here...
Read the entire article here...
Troubleshooting Login Slowdowns: How ControlUp Can Help
A user asked for help with login slowdowns and received suggestions to use CU4VDI trigger to run the ALD script, deploy ControlUp Disk Monitor, and run API queries to gather data. The AI Assistant or Claude/Gemini/ChatGPT can be used to correlate the data and determine the root cause of the issue. The ControlUp PS team is also available for assistance.
Read the entire article here...
Read the entire article here...