The group discussed the discrepancies between the CPU percentage on a single host and the "Host CPU Usage" column for all VMs on that host. The data for the host level comes from the hypervisor platform, while per-VM CPU comes from the ControlUp agent on the Windows OS. It was mentioned that the console is not effective for comparing data due to potential performance issues. The behavior of the host CPU reaching 100% and the VMs not going higher was deemed expected. It was clarified that the host CPU in the "Machine view host CPU" column refers to the CPU utilization by the VM as reported by the hypervisor API. The monitoring intervals for the agent and API may also result in different reported numbers.
Read the entire ‘Understanding CPU Metrics in ControlUp’ thread below:
Is this an issue, or by design? If by design, can someone explain the logic?
Environment:
Omnissa Horizon running on Microsoft AVS(vmware hosted in Azure)
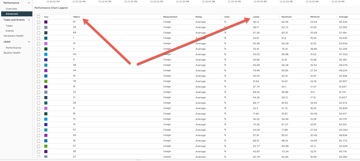
Running some tests. First screenshot, I’m looking at the CPU percentage on a single host, running at 100%. But when I click on that host, look at all the VM’s running on this host(Second screenshot), the "Host CPU Usage" column doesn’t show 100% on all VM’s.


On the host level the data comes from the hypervisor platform (e.g. ESXi/vcenter)
The per VM cpu I think comes from the agent (windows OS)
So the host CPU is not an average from the VMs I think
You could verify what your hypervisor management platform reports
I’m not saying that there couldn’t be a bug, but the data is not a roll up number afaik. They’re from different sources
I would have expected the "Host CPU Usage" to also come from vCenter/esxi. How can Windows VM collect Host CPU metrics at all?
But I will look at what vCenter is reporting.
Oh, now I see
Sorry, I was reading too fast
Let me have a look when I’m at my desk again at our environment
Can you also check the console to see if it’s reporting the same numbers
The console is basically useless for us at this point when we connect to too many devices. It locks up on us and were not able to use the interface. Either our machines are not powerful enough for that many connections or something else. We have the recommended settings and etc but still locks up.
And I need to connect to quite a few machines in order to look at the same data unfortunately, so it’s making comparison between the two very difficult/impossible.
Got it
well this could be perfectly well behaviour, if the host cpu is at 100% there is no room for the vm’s to use more hence them not being able to go higher than they are. And yes host cpu comes from the hypervisor connection and gets this data from the aggregation we do per vm/agent. It’s not reporting the cpu usage of the host itself but the cpu usage of the vm according to the host.
Ok, so to sum it up:
• Host view CPU: from hypervisor API (e.g. vcenter)
• Machine view CPU: from CU agent inside VM
• Machine view host CPU: the CPU utilization by the VM as reported by the hypervisor API
Is this accurate Wouter?
Also note that our agent is on 3 seconds update interval and the API is less frequent, so there could be different numbers reported
that’s correct
Would it happen to be collecting this information by chance for the "Machine view host CPU:"
Screenshot is vCenter, single host, advanced monitoring, looking at CPU % for each core for that host.
Notice the measurement column. Is it usage or utlization, or other?
Continue reading and comment on the thread ‘Understanding CPU Metrics in ControlUp’. Not a member? Join Here!
Categories: All Archives, ControlUp One Platform