
ControlUp does not currently offer direct insights into Microsoft Teams meeting recordings or their access logs. Meeting recordings in Teams are stored in the organizer's OneDrive or SharePoint, depending on the meeting type. For private meetings, recordings are saved to the organizer's OneDrive, while channel meetings store recordings in the SharePoint site associated with the channel. ([learn.microsoft.com](https://learn.microsoft.com/en-us/MicrosoftTeams/tmr-meeting-recording-change?utm_source=openai))
To monitor access to these recordings, organizations can utilize Microsoft Purview, which provides auditing capabilities for Teams content. Purview allows administrators to track activities related to meeting recordings, such as who accessed or shared the recordings. This functionality is particularly useful for compliance and security purposes. ([learn.microsoft.com](https://learn.microsoft.com/en-us/purview/edisc-search-teams?utm_source=openai))
Additionally, meeting organizers can manage access permissions for their recordings directly within Teams. By default, access is set to "Everyone," but organizers can customize this setting to restrict access to specific individuals or groups. This control ensures that only authorized users can view or download the recordings. ([support.microsoft.com](https://support.microsoft.com/en-us/teams/meetings/customize-who-can-access-a-recording-or-transcript-in-microsoft-teams?utm_source=openai))
In summary, while ControlUp does not provide direct insights into Teams meeting recordings, organizations can leverage Microsoft Purview for auditing access and utilize Teams' built-in features to manage recording permissions effectively.
Read the entire article here...
Unified Communications Related Training & Support Archives
Unified Communications training and support-related archives from inside the ControlUp Community on Slack.
How to Diagnose Microsoft Teams SlimCore Optimization in Citrix and Other VDI Environments Using PowerShell Scripts
This discussion highlights two PowerShell scripts developed to aid tracking and diagnosing Microsoft Teams SlimCore Optimization specifically within Citrix environments, with potential applicability to Azure Virtual Desktop (AVD), Windows 365 (W365), and VMware Horizon sessions. SlimCore is an optimized media stack used in virtual desktop infrastructure (VDI) scenarios to enhance Teams call performance by offloading audio and video processing to the client side.
Read the entire article here...
Read the entire article here...
Monitoring CPU Thermal, Power, and Frequency Throttling with Custom ControlUp Scripts and Dashboards
A common challenge in monitoring CPU performance is that traditional CPU utilization metrics often fail to reveal the underlying causes of slowdowns, especially in cases related to thermal or power throttling that reduce CPU frequency without triggering high CPU%. To address this, a detailed custom PowerShell script and accompanying dashboard have been developed to report CPU temperature, frequency, and distinct throttling signals in a granular and actionable way. This solution creates a dedicated data index named `custom_cpu_throttle` to track multiple independent throttling signals, enabling more precise diagnostics of CPU performance issues.
The core innovation of this approach lies in splitting CPU throttling indicators into three separate categories: thermal throttling (hardware/BIOS-related issues such as overheating or dust), power throttling (policy-related causes like power plans, Intune profiles, or BIOS max-state configurations), and frequency throttling (cases where the CPU clock speed drops below 85% of the rated max under load, capturing otherwise silent throttling scenarios common on AMD processors or CPUs with boost frequencies). By differentiating these factors, the method captures scenarios where traditional Event ID 37 logs or CPU utilization metrics miss critical performance degradations.
The script captures a range of per-device metrics during each run, including temperature and its source, throttle status types, current and maximum CPU frequency with a ratio percentage, and comprehensive throttling evidence logs that correlate performance drops with frequency and utilization data. This data feeds into a customizable ControlUp dashboard that aggregates key performance indicators, categorizes throttle types, tracks frequency trends, and identifies devices exhibiting the hottest or most throttled behavior. The dashboard also correlates these metrics with user experience signals like application crashes and digital employee experience (DEX) scores, enabling targeted troubleshooting from a single pane of glass.
Technical details specify that the solution runs on Microsoft Windows devices using PowerShell scripts triggered every two minutes (120 seconds) with a 60-second timeout and sends data to the `custom_cpu_throttle` index only when devices are online. The solution supports filtering by device, throttle type, and status for focused analysis. While the script covers many AMD-specific throttling scenarios, some complexities remain given AMD's diverse behaviors, though unrealistic values are filtered out to maintain accuracy. This tool is well-suited for IT administrators and helpdesk teams looking to resolve performance tickets where CPU utilization appears normal but throttling impacts response times, such as in Outlook or other user-facing applications.
For detailed setup or a walkthrough, the script (`SP-CPU-Throttle-v2.ps1`) and ControlUp dashboard configuration (`SP-CPU-Throttle-Dashboard.json`) are available on request. This solution is an example of extending ControlUp’s monitoring capabilities via custom scripts and dashboards to deliver deeper insights into CPU performance issues that go beyond default instrumentation.
Read the entire article here...
Read the entire article here...
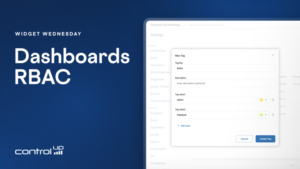
Widget Wednesday #24: Managing Dashboard Access with Roles and Tags
Widget Wednesday #24 explores new dashboard roles, tags, and sharing capabilities in ControlUp Dashboards, helping administrators organize dashboards and control user access more effectively.
Read the entire article here...
Read the entire article here...
Utilizing Microsoft Teams API with ControlUp UCC dashboards
A user named Seb shared three ControlUp UCC dashboards that use Microsoft Teams API data only - no CU4D agent needed. The dashboards show real Teams call quality and usage before the agent reaches the endpoints. It includes graphs for daily, weekly, and monthly trends, as well as MOS bands and per-user statistics. These dashboards can be customized to specific needs. Other users showed appreciation for Seb's contribution.
Read the entire article here...
Read the entire article here...
Formatting Message Text on Microsoft Teams
A discussion about formatting message text on Microsoft Teams was had, with the suggestion to use the "Send Message to Channel" integration to define titles and flag messages as important using Markdown or Adaptive Cards. A sample JSON payload was provided for reference. The user who brought up the question was encouraged to try it out and report back on their experience.
Read the entire article here...
Read the entire article here...
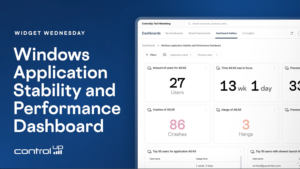
Widget Wednesday #22: Windows Application Stability and Performance Dashboard
Widget Wednesday #22 explores the Windows Application Stability and Performance Dashboard, providing insights into application crashes, hangs, freezes, resource usage, launch performance, and version comparisons.
Read the entire article here...
Read the entire article here...
How to Pinpoint CPU-Heavy Processes Across Your VDI Fleet with ControlUp
This thread walks through a real customer question: how do you find which processes are eating the most CPU across a large VDI estate (200 servers) over a long period, so you know what to optimize?
It starts in ControlUp Dashboards. Using the VDI process data, you can build a widget showing top processes by CPU, then narrow it to the machines you care about using global filters (filter by folder, or switch to query filters with IS / IS NOT). A table beats a bar chart for a top-50 view, and any filters and time frames you set are saved in the URL, so you can bookmark or share the exact view. The built-in Gallery dashboards (notably "Big Screen Dashboard VDI") already include a processes-by-CPU widget out of the box.
The harder part is the one the customer really cared about: getting a meaningful picture across all machines rather than a single noisy spike on one box. The data is stored per process per 5-minute timeslot, not pre-aggregated per machine, so the practical approach that emerged was:
Filter to the folder containing all target machines.
Use CPU usage P95 to strip out short, expected spikes (with a fallback to average CPU, since P95 returned N/A in some environments — a possible bug worth a support ticket).
Add metrics under Advanced: computer_name (unique count) to see how many machines run the process, and process_name (count) to see how often it appeared (each record ≈ a 5-minute aggregate).
The processes worth optimizing are the ones combining high CPU + high machine count + high record count.
Worked example: a process showing ~1,080 records across 197 machines roughly translates to ~90 hours of activity over 7 days, or a few minutes per machine per day. The same method surfaced candidates like CompatTelRunner.exe, WerFault.exe, and WEM-related activity for further investigation. To go deeper, the App Trends and App Statistics reports let you drill into a specific app, and product_name data helps identify what's actually behind generic process names like setup.exe.
A few important caveats came up: averages hide spikes (10% average could be one minute at 100%), process counts are per machine, and hypervisor-level CPU (e.g., XenServer) can disagree with in-VM agent data when hosts are over-provisioned — which is also why a Sizing Recommendations report may suggest removing vCPUs even on a machine that looks maxed out.
Bottom line: use the dashboard to identify the heavy processes (folder filter + P95/avg CPU + machine count + record count), then use the App Trends report to dig into the details per app.
Read the entire article here...
Read the entire article here...
Automating Notifications for Users with Low WiFi Signal in ControlUp
A discussion was held about using workflows to automate notifications for a high volume of users experiencing low WiFi signal on corporate WiFi. Ideas were shared about centralizing events and using AI features in ControlUp to count the number of affected devices and trigger an email or teams message. The suggested solution involved querying the _devices and device_status to gather relevant data.
Read the entire article here...
Read the entire article here...
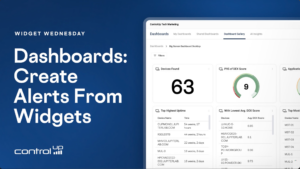
Widget Wednesday #19: Create Alerts Directly from Widgets
Widget Wednesday #19 introduces the Create Alert feature in ControlUp Dashboards, allowing users to generate alerts directly from widgets with pre-filled settings, flexible thresholds, and integrated automation actions.
Read the entire article here...
Read the entire article here...