
A user asked about using the Grid layout to deduplicate entries in a custom index, and specified that the end goal was to see unique computer names and their total count. Another user suggested using a Table Widget and selecting Device ID as the field, with an aggregation of Total and grouping by Device Name. The user was able to achieve their desired result, but brought up the limit of 50 unique entries and questioned its necessity. It was clarified that this limitation is due to technical restrictions, but it may be expanded in the future.
Read the entire article here...
ControlUp Dashboards
How to View Device and Experience Scores in ControlUp Dashboard
Some employees were discussing the combination of Device Score and Experience Score in a consolidated view or score. @member asked if there was any built-in reports or dashboards to view this combination, and @member answered that it exists within the DEX Score Trending Dashboard from the Dashboard Gallery. However, there was some confusion as to whether this data is based on the Device Score or the Experience Score. It was clarified that the metric used is the Experience Score, and the breakdown of this score can be found in the Employee module. The team discussed different ways to view and analyze this information, and it was suggested that a call be set up for a deeper dive into the dashboards. The conversation also referenced ControlUp URLs such as https://support.controlup.com/docs/device-score and https://support.controlup.com/docs/experience-scores.
Read the entire article here...
Read the entire article here...
Overcoming Limitations with Grid Panels in Dashboard Building: A ControlUp Discussion
The team discusses limitations with grid panels in building a dashboard from GPO logon capture data. Suggestions to overcome limitations include using tables instead of grids, setting the index to overwrite, using group by in a table, and switching to advanced raw builder. An example code for adding multiple metrics in the raw builder is also shared. A feature request for adding group by option in grids is submitted.
Read the entire article here...
Read the entire article here...
ControlUp Releases New Live RMM Feature with Temperature Graph
A new live RMM feature has been released by ControlUp, which includes a three second interval temperature graph. This feature is separate from the default historical view, but a custom dashboard can be used to display the information. Updates to the historical view may be released in the future.
Read the entire article here...
Read the entire article here...
Troubleshooting ControlUp Data and Scripts
A user asked about why there wasn't any data showing. Another user explained that there was a prerequisite for it to populate, and guided them to find and enable the necessary script in the Script Library. They also mentioned adding a pop-up to dashboards to make prerequisites clearer. Script locations were shared as well.
Read the entire article here...
Read the entire article here...
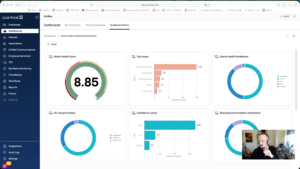
Widget Wednesday #18: New Filter UI and Unified Filtering Experience
Widget Wednesday #18 introduces a redesigned filter UI in ControlUp Dashboards with expanded filtering options, unified variables and filters, and improved usability for faster, more flexible data analysis.
Read the entire article here...
Read the entire article here...
Utilizing Triggers in ControlUp: A Guide to Reporting and Tracking Trends
A user asked for help in creating a report to track trends and confirm impact of their work on reducing "Black Hole Machines" alerts, and wondered which Source to use in order to add a widget. Another user mentioned that Events are stored platform-wide and can be accessed through the Events section, but may need to be exposed via API.
Read the entire article here...
Read the entire article here...
Exploring Data Export and Filtering Options on ControlUp
A user is suggesting the functionality to export all filtered data from a Grid widget on ControlUp. Another user mentions that this requires a mechanism to load each page and combine them in a CSV using the API or Powershell. The idea of creating filters using other indexes is suggested, with the possibility of using Workflows or variables. The conversation ends with the mention of an update to ControlUp's filters with 20+ built-in global filters and a new UI.
Read the entire article here...
Read the entire article here...
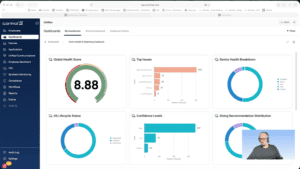
Widget Wednesday #17: Device Health and Rightsizing Dashboard
Widget Wednesday #17 introduces the Device Health and Rightsizing Dashboard, a read-only dashboard with pre-calculated health scores based on 30-day data, providing consistent and up-to-date device health insights.
Read the entire article here...
Read the entire article here...
Training and Documentation for Custom VDI Dashboards in ControlUp
The customer is looking for a training or documentation on creating custom dashboards for VDI. @member suggests a community session on the topic was conducted but the customer's requirement is slightly different. @member offers to help and mentions the upcoming release of VDI dashboard in the gallery. Unique count and time series for VDI support are expected to be released next week and early next month respectively.
Read the entire article here...
Read the entire article here...